![econlifelogotrademarkedwebsitelogo[1]](/wp-content/uploads/2024/05/econlifelogotrademarkedwebsitelogo1.png#100878)

October 12, 2020
The Lawrence Livermore National Laboratory's annual flow chart is the easy way to see all you want to know about U.S. energy use.
The Lawrence Livermore National Laboratory's annual flow chart is the easy way to see all you want to know about U.S. energy use.
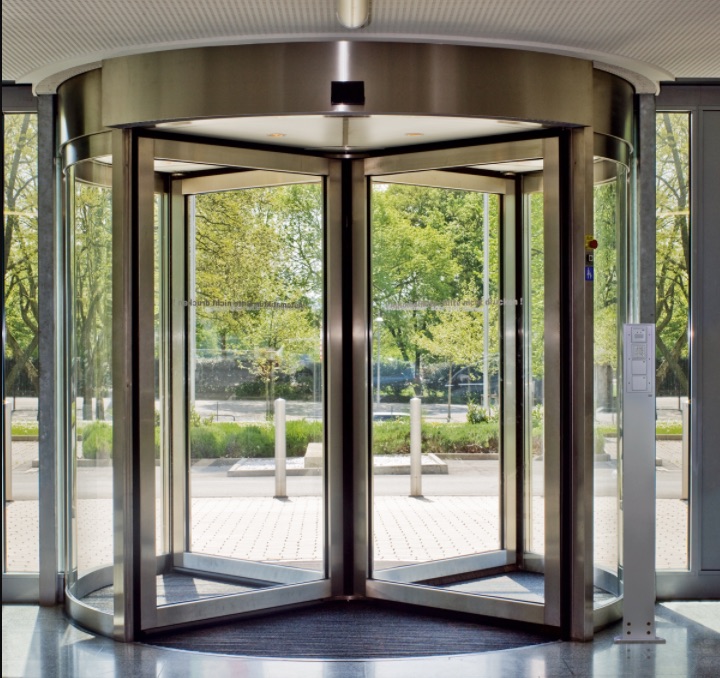
Increasing everyday sustainability, using a revolving building door rather than one that swings would add less to our individual carbon footprint.