![econlifelogotrademarkedwebsitelogo[1]](/wp-content/uploads/2024/05/econlifelogotrademarkedwebsitelogo1.png#100878)

June 28, 2026
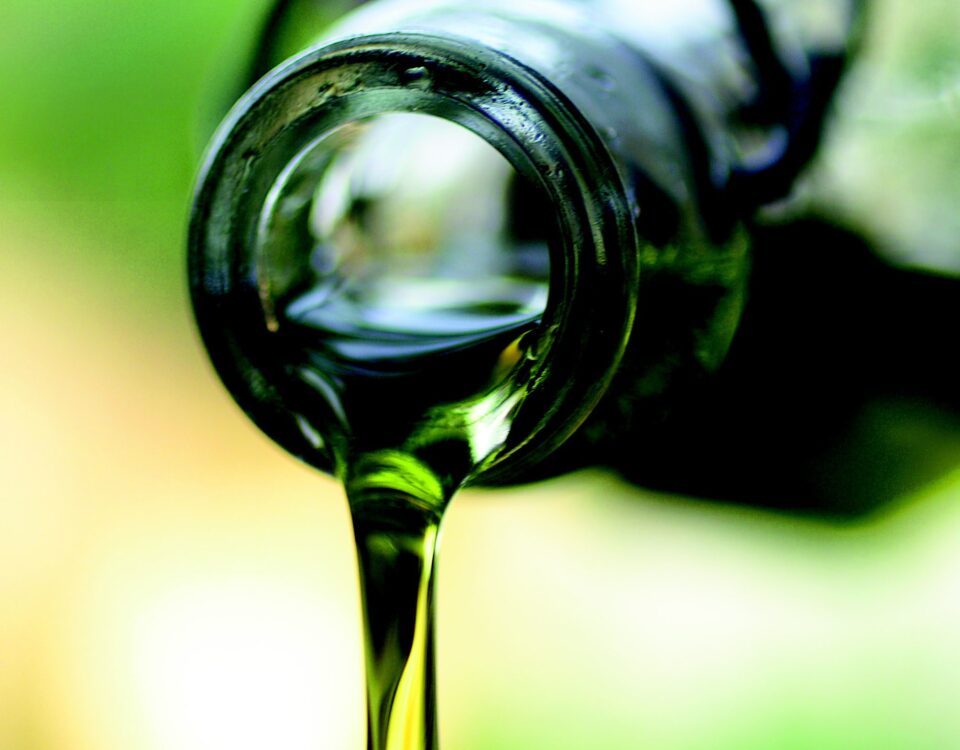
By looking at global warming through the olive crop, we can grasp the meaning of a more general phenomenon.
By looking at global warming through the olive crop, we can grasp the meaning of a more general phenomenon.
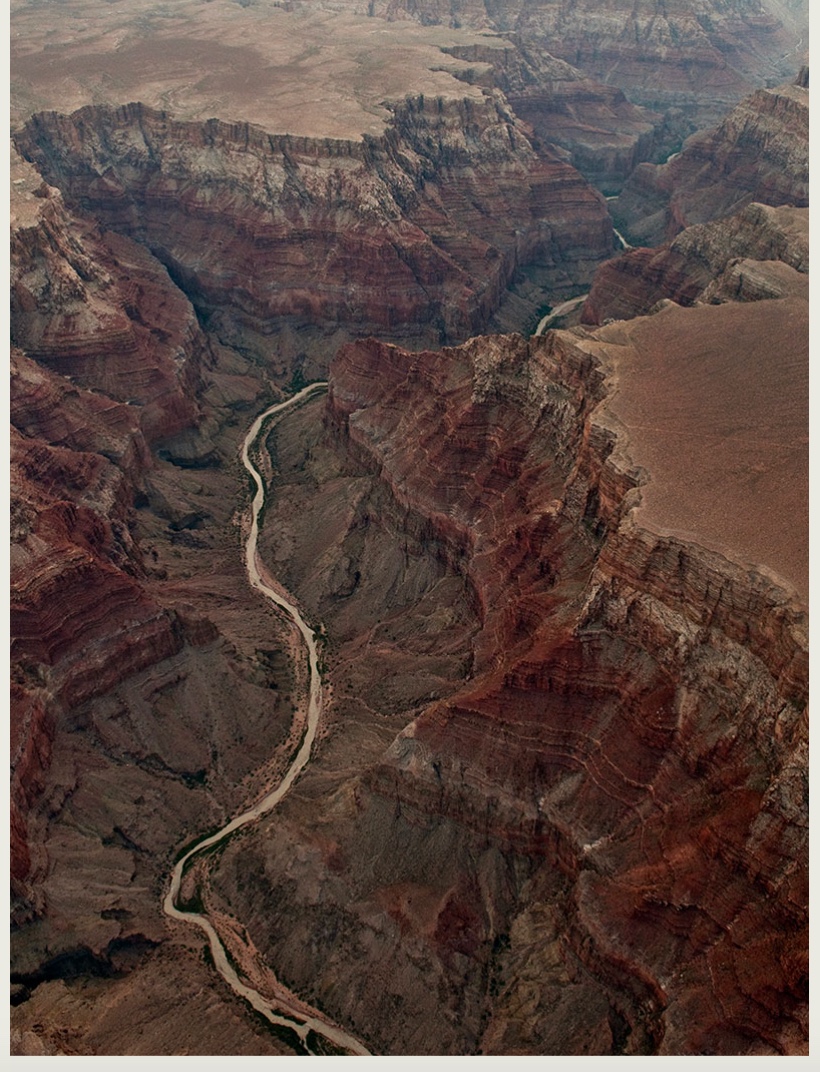
Even with a massive water crisis, the states that need the Colorado River have been unable to make the necessary tradoffs.
While we can look at India's noisy cities for extreme examples, everywhere, car horns and traffic sounds harm us.
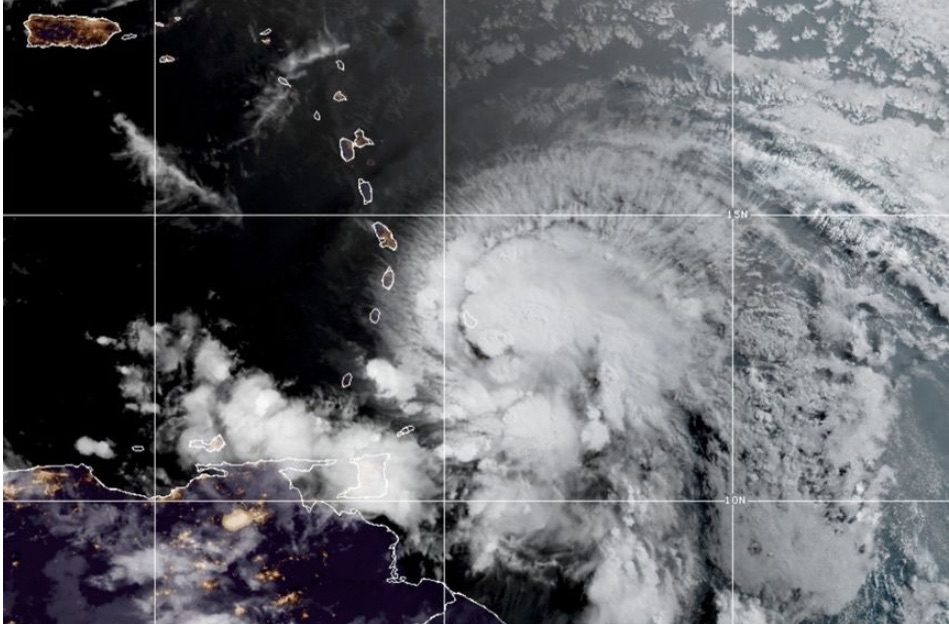
Looking back at the devastation from Katrina and Sandy, economists can explain why superstorm planning remains inadequate.
More than a nuisance, the cost of the noise pollution near airports and highways can affect the value of our homes.
A toothpaste tube presented a dilemma when its designers helped the environment by violating a 19th century law.
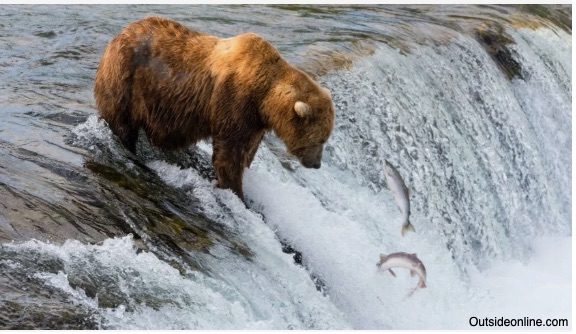
Looking at global warming hot spots, we find problems that range from hungry bears to nut and cocoa surprises.
We need geographical supply and demand data to calculate, compare, and constrain GHG emissions in U.S. cities.
An all-purpose solution to many problems, the power of the market can slow the decline of killer whales and reduce food waste.
While Fat Bear Week's contest is somewhat lighthearted, it relates to Alaska's more serious development tradeoffs.
Not necessarily giving us more vacation, instead, longer summers at the beginning and end, just have extra costly days that are hot.
With average global temperatures rising, naming heat waves can create the incentives that encourage appropriate fiscal policies.


