![econlifelogotrademarkedwebsitelogo[1]](/wp-content/uploads/2024/05/econlifelogotrademarkedwebsitelogo1.png#100878)


Why the Inflation Reduction Act Needs a New Name
August 17, 2023
August 2023 Friday’s e-links: Two Great Movies
August 18, 2023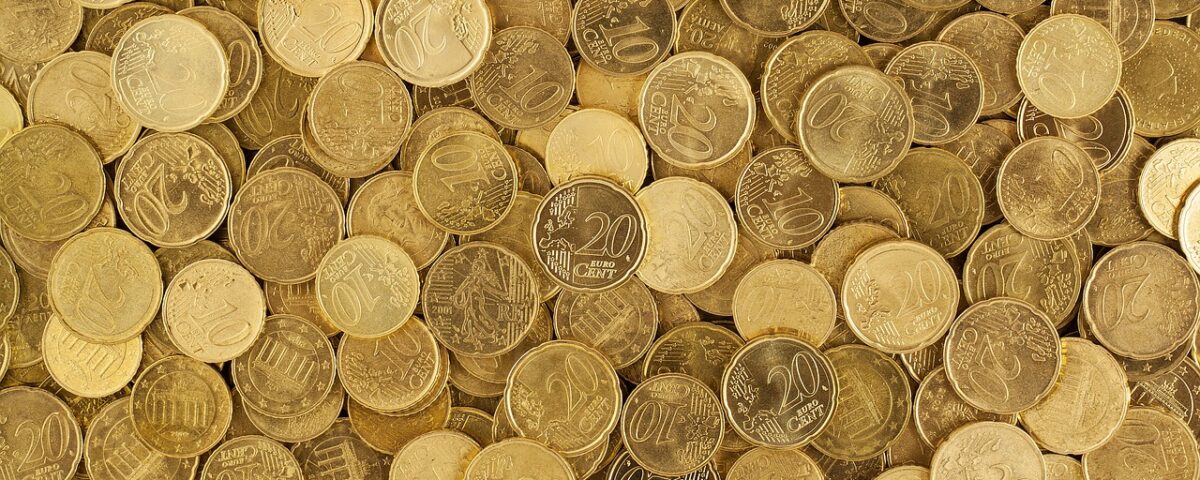
In What If, Randall Munroe gives us a new way to look at income inequality.
Someone paid in loose change earning an hourly federal minimum wage of $7.25 could take a day’s pay home in a plastic water bottle while a median household would need three or four bottles. At the same time, taking home $40,000 per workday, a typical CEO would need 600 water bottles filled with coins.
Next, taking the huge leap up to Mark Zuckerberg (and other billionaires), we are looking at 25 water bottles filling with change per second:

Where are we going? Asked who is wealthy, the answers vary.
Deciding Who Is Wealthy
When the House Ways and Means Committee proposed that the top tax rate should apply to people earning $400,000 and more, they let us know who was wealthy.
Also though, a financial psychologist told us that, “Rich is just the term we use to describe people who have more than us when we don’t think they deserve it…The definition of rich is entirely subjective…$400,000 is just an arbitrary number–it might make you ‘rich’ in Middle America but middle class on the coasts.”
Simplifying our quest for a definition, Yahoo Finance tells us some numbers. Looking at what the IRS calls the top 1%, then an annual income of $540,009 would make you wealthy. However, the Economic Policy Institute pulls that number up to $819,324.
But then, changing our focus, we can ask who the financial industry calls wealthy and use net worth as a metric. Here, $1 million is considered high net worth, very high is $5 million to $10 million, and ultra-high net worth takes us beyond $30 million.
However, when Charles Schwab asked you and me about what we think is wealthy, the answer was $2.2 million:

But perhaps, the common denominator is what all of us believe money means:

Our Bottom Line: Income inequality
Taking the next step, we can ask about wealth distribution. The following Pew graphic gives us a picture of the U.S.:

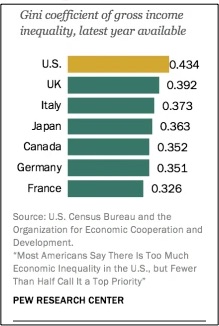
Meanwhile, we can use Gini Coefficients to compare countries. On a scale of 0 to 1, the Gini number indicates more income inequality as it ascends. Consequently, zero is perfect equality while 1 is complete inequality.
Among the G-7 countries, the U.S. tops the Gini list:
Returning to where we began, we can see how water bottles and Gini Coefficients come in handy.
My sources and more: Always fun as a source, Randall Munroe was the perfect springboard for income inequality. From there, the NY Times had more about what is wealthy. Then, with the statistics, Pew Research, the Charles Schwab Modern Wealth Survey 2022, and Yahoo Finance completed the picture. But still, there is more in this past econlife.

