![econlifelogotrademarkedwebsitelogo[1]](/wp-content/uploads/2024/05/econlifelogotrademarkedwebsitelogo1.png#100878)


Where People Prefer Non-Cash Transactions
February 16, 2020
Why Reports of a Retail Apocalypse Are Greatly Exaggerated
February 18, 2020
Five years ago, two Princeton University economists asked how much a President can control the success of the U.S. economy. They pointed out that economic performance was better under Democrats. But then they wondered whether the reason was luck or some other externality over which a President had little control.
Before looking at why, first let’s take a look at how the Presidents have fared economically since World War II. And then we can decide whether it was their fault. Because our metric is the real GDP growth rate, we are just looking at the change in the dollar value (adjusted for inflation) of the annual production of goods and services.
Measuring Economic Performance
Between 1948 and 2012, real GDP growth averaged 3.3 percent. For Democrats the average was 4.33 percent; and Republicans, 2.54 percent:

But there is much more to the story. Certain Republicans fare beautifully when we look at their best GDP year rather than an average. Going by their best years, Eisenhower and Reagan look pretty amazing: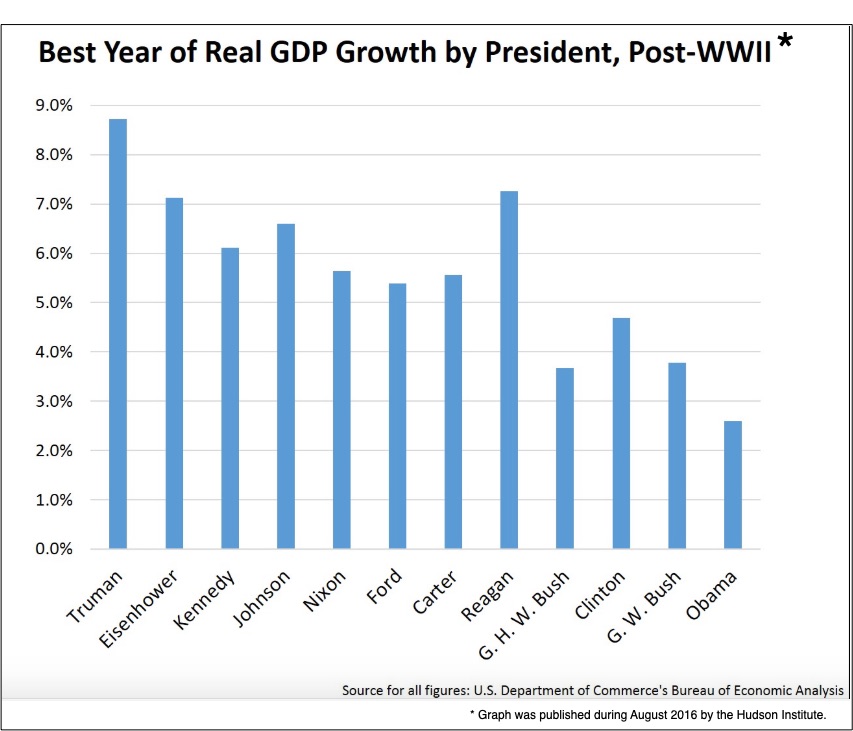
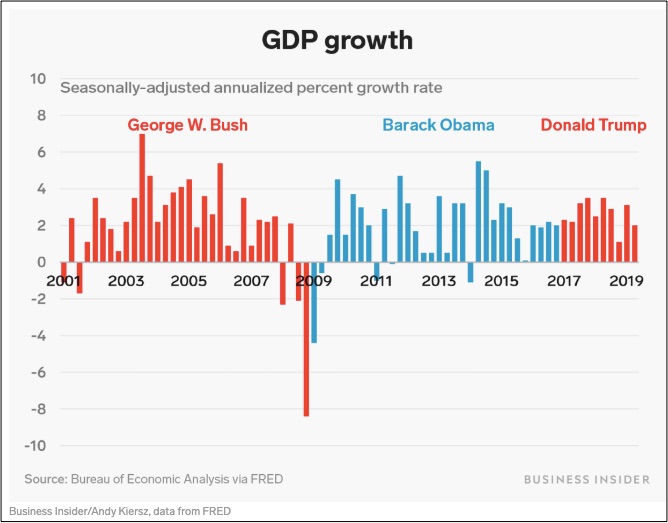
More recently though, you can see the growth slowdown. President Trump’s average is close to 2.5 percent:
Impact
Trying to figure out why GDP grows, our two Princeton economists suggest that a President’s policies are not the main reason. In their study, they found no fiscal or monetary decisions that consistently boosted growth rates. It wasn’t momentum from the previous President or the party that controlled Congress. Instead they hypothesized that oil prices, defense spending, business productivity, and other countries’ growth rates made some of the difference. Otherwise, they said it was a mystery..
Our Bottom Line: Why Care About the GDP
The GDP’s three largest components can tell us why the GDP is a valid performance metric. At 70 percent of the total, Consumption Expenditures display the services, and the durable and non-durable goods we buy that reflect our standard of living. (Durable good last longer than three years, nondurables, less.) Meanwhile, Gross Investment takes us to business spending and residential housing. A rise in business spending can mean jobs, efficiency, productivity. As for residential housing, we can remember how home ownership has been called the American Dream. And finally, with government spending, goods and services purchases should come to mind rather than transfer payments like Social Security. Ranging from education to defense, the federal budget reveals how government spending can improve our lives.
So yes, we know that GDP makes a difference. But how will our vote affect the GDP?
My sources and more: Business Insider, The Washington Post, and the Hudson Institute had the numbers. Meanwhile, although dry, this paper had some interesting analysis.
