Our Weekly Economic News Roundup: From Elevator Etiquette to Restaurant Takeout
June 13, 2020
Why a Fish is Like a Pig
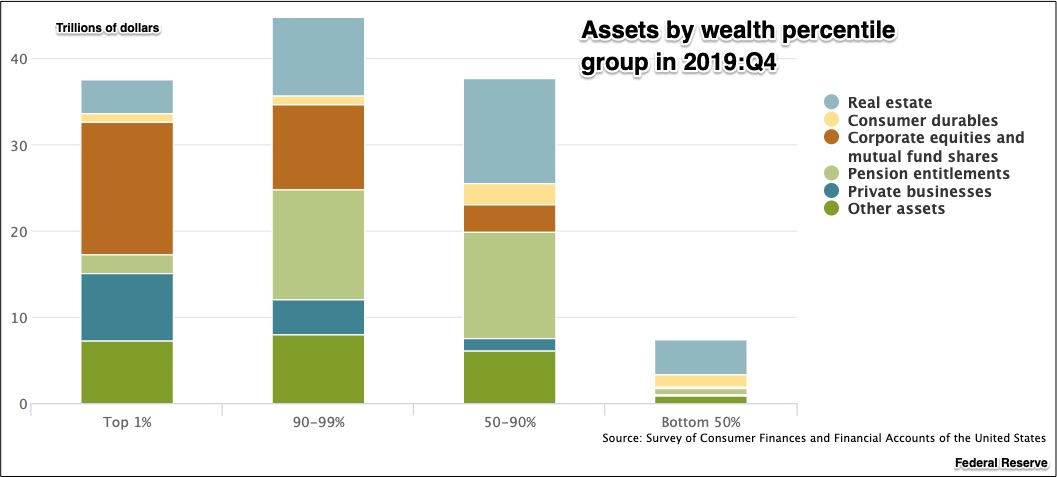
June 16, 2020When the Federal Reserve looks at our wealth, they think of our assets and liabilities. For many of us a house is our biggest asset. Then, the value of our securities, the businesses we own, what our pensions might be worth, and our durable goods (goods that last three years or more) are among the other things they would include.
Below you can see that a larger proportion of the wealth of the most affluent comes from stocks and bonds. Next, moving down the wealth ladder, real estate and pensions become more dominant:
On the minus side, for everyone but the top 1%, a mortgage is a big item as might be credit card debt:
Where are we going? First to overall wealth distribution and then to the houses and securities we own.
Wealth Distribution
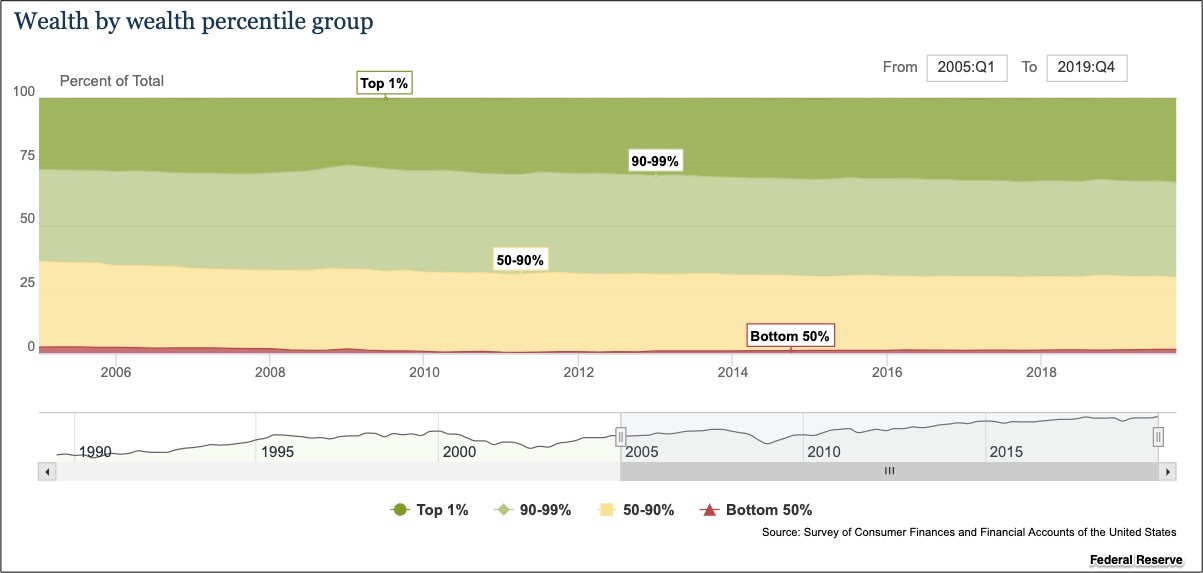
In the United States, the top three percentile groups have a relatively equal share of the wealth. Moving downward from the top 1%, to the next 9%, to the 50%-90% group, the share of each one is not too far from 30%. But then we leap downward to the bottom 50 percent with a 1.5 percent share:
In terms of trillions of dollars, the top 1% has $36.8 and the bottom 50%, $1.66:
Wealth Sources
Let’s take a look at some sources of the wealth in the upper quintiles and at what those in the lower fifth do not own.
Housing
Among the four generational cohorts, the Baby Boomers own the most real estate: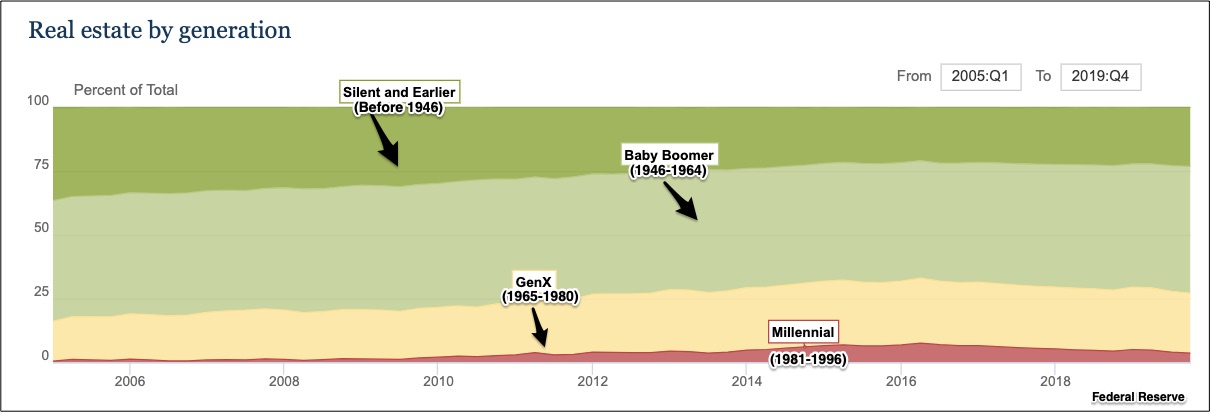
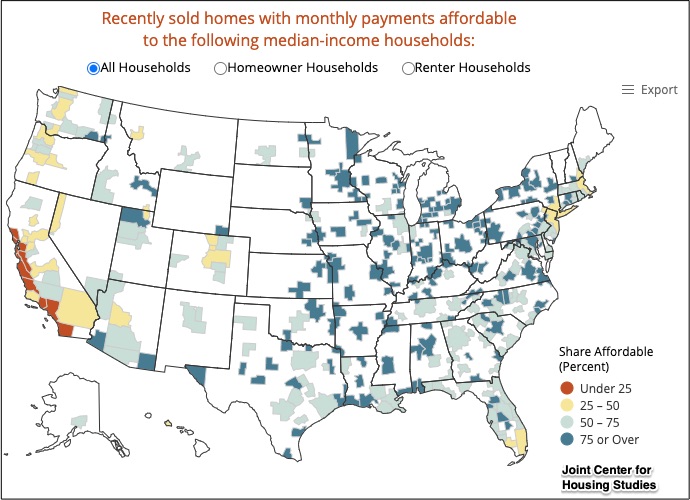
Shown by red and yellow shading, the least affordable homes are primarily located near the West and East coast:
Securities (stocks and bonds)
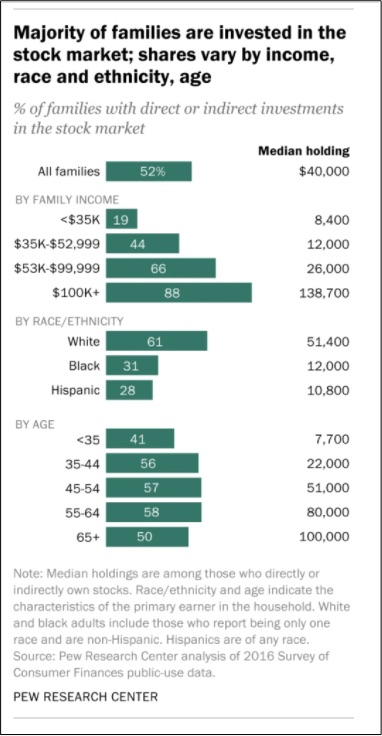
Again, the divide is evident. Families with higher incomes have more money invested in stocks and bonds:
Our Bottom Line: Gini Curves
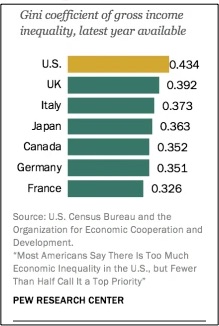
Thinking about wealth distribution took me to Gini Coefficients although they are usually based on income. Through a scale of 0 to 1, we can use a Gini Index to quantify inequality in a country. The higher the number, the more unequal the distribution of income or consumption expenditures. Zero is perfect equality while 1 is complete inequality.
Pew Research shared Gini Coefficients for the G-7 countries:
Returning to where we began, asset allocation among different income groups provides insight about the relatively high Gini Coefficient for the United States.
My sources and more: The Pew FACT TANK is always a handy source for data on an up-to-date issue like securities ownership. Similarly, Harvard’s JCHS had the recent housing information while the Federal Reserve conveyed the big picture.
![econlifelogotrademarkedwebsitelogo[1]](/wp-content/uploads/2024/05/econlifelogotrademarkedwebsitelogo1.png#100878)


