![econlifelogotrademarkedwebsitelogo[1]](/wp-content/uploads/2024/05/econlifelogotrademarkedwebsitelogo1.png#100878)


The Story of a New Apple (Called the SnapDragon)
November 4, 2020
How Dating Markets Have Changed
November 6, 2020
Beer consumption easily tops wine as the most popular global alcoholic beverage.
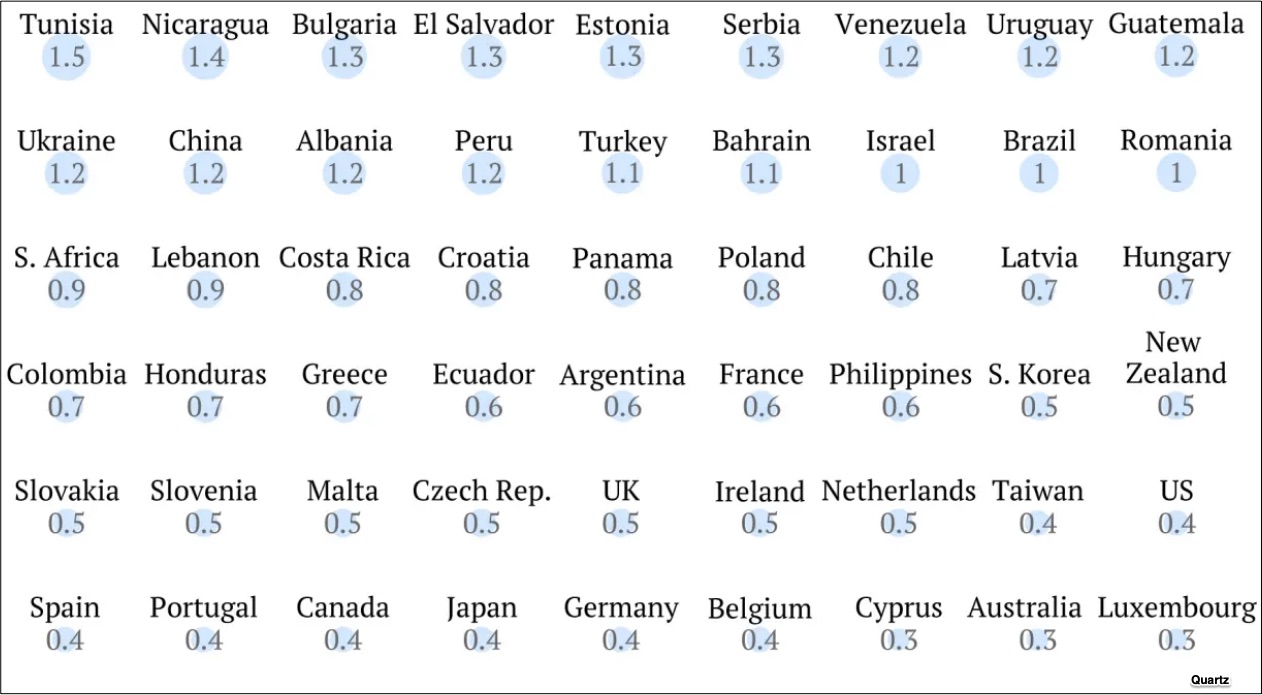
Quartz had this wonderful “beer indicator” showing how long people had to work to buy a .5 L draught domestic beer in a bar or restaurant. While their data is from 2011, still it gives us a pretty good idea of where beer was relatively expensive.
At 15 hours, a worker in Georgia paid somewhat close to one half of a 40-hour workweek:
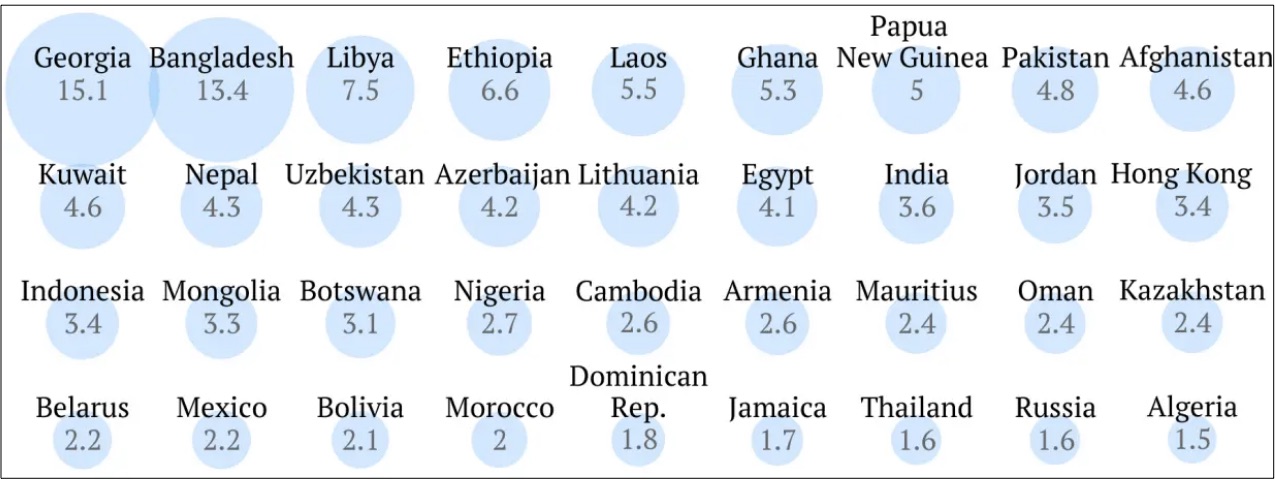
Then, with Algeria and Tunisia, it became much less costly:
From here, let’s move to the big picture.
Global Beer Consumption
The ups and downs of beer consumption depend on where you live. In traditional European beer drinking countries like Germany, Belgium, and the U.K., beer drinking is declining. As for Europe’s bigger beer drinkers, the Czech Republic and the Irish rank near the top. Meanwhile, the U.S. and Australia are among the non-European countries for the highest beer consumption.
For a summary from 2014, do take a look below:
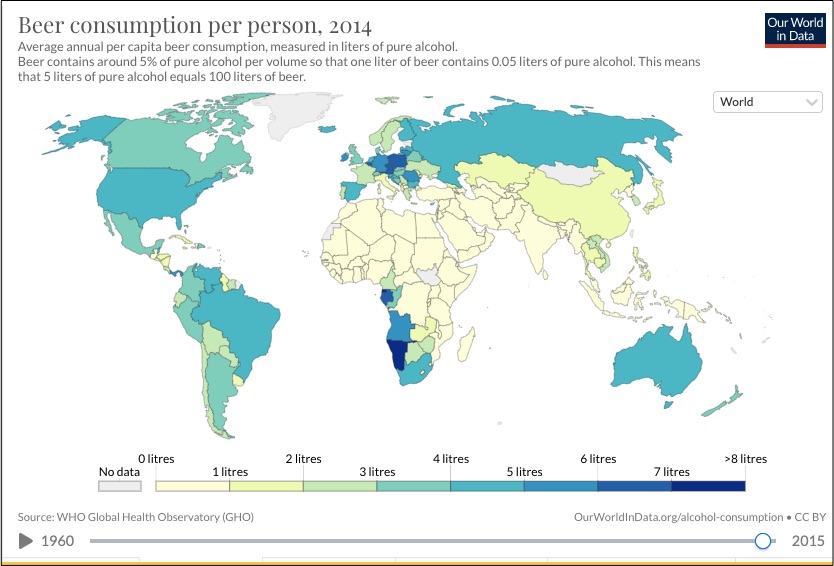
Then, for some history, we can start in 1960:
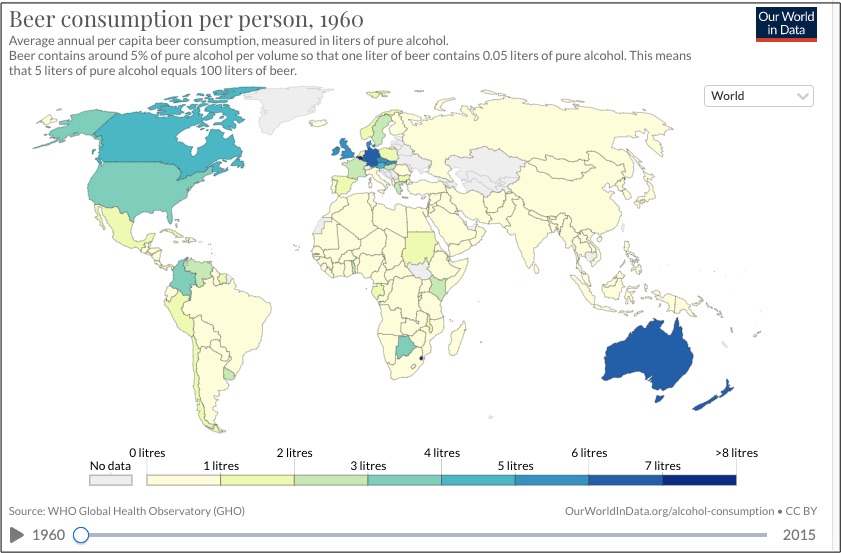
Meanwhile, increasing income and globalization are two reasons for the spread of darker blues.
1980:

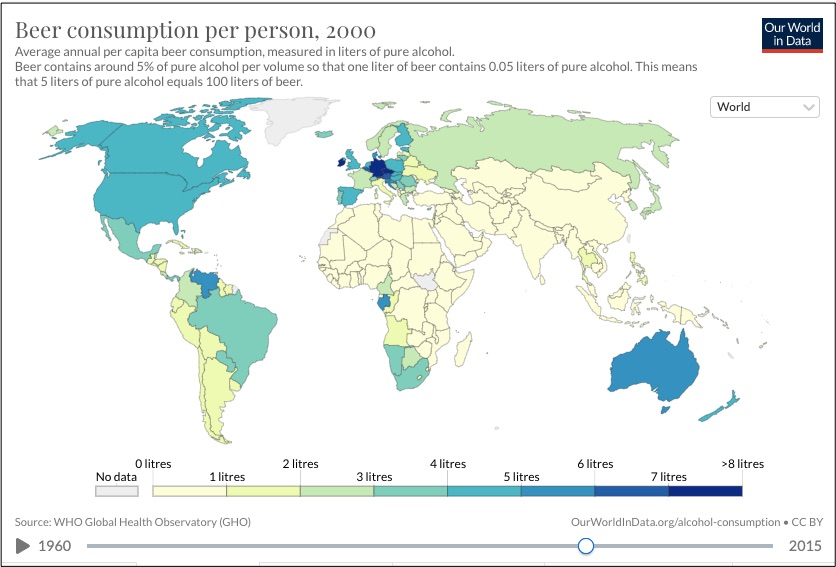
Researchers also tell us that Russians were replacing vodka with beer while in Spain and Italy too, beer drinking has been climbing.
2000:
Our Bottom Line: Determinants of Demand
As economists we can look at the determinants of demand to explain the changes in beer consumption. Defined as the reasons that an entire demand curve increases or decreases, beer’s non-price demand determinants include income, globalization, substitutes and complements, product characteristics, and taxes.
As a demand determinant, income is especially interesting. Imagine an inverted U. As income goes up in a developing nation, beer intake rises, perhaps (according to one paper) at per capita annual income of $22,000. Then though, as affluence increases, maybe at $26,500, people can afford pricier liquor. The switch though can also occur in a high income economy. In the U.K., a recent YouGov poll indicated that cheaper wine has been replacing beer.
Below you can see how beer demand changed in eight countries since 1960. As the red line at the top, Australia has the most drastic drop:

Perhaps we can end where we began. Because it still matters how much of your workday it takes to buy a draught, price also affects the quantity of beer that we demand.
My sources and more: This (gated) FT article about wine enticed me. Then, this Economist article and Quartz added to the economic picture of beer. For an academic perspective, these papers had the data, here and here. Finally, you might have some fun as did I with Our World in Data.
Please note that in a future econlife we will do an update with pandemic alcohol consumption.


