We could say that the CARES Act is one-size-fits-all. As a source of stimulus cash sent to individual households and of Paycheck Protection business loans, it temporarily jumpstarted a stalled economy. However, because the aid was indiscriminate, the initiative insufficiently targeted those who really needed it.
Let’s take a closer look.
COVID-19 Consumer Spending
Through recent research, we can see what really is happening to consumer spending.
When the lockdowns began, all of us spent less. The big number was a 33 percent plunge in consumer spending during March. But after stimulus checks arrived, by mid-April, spending resumed.
Big Data
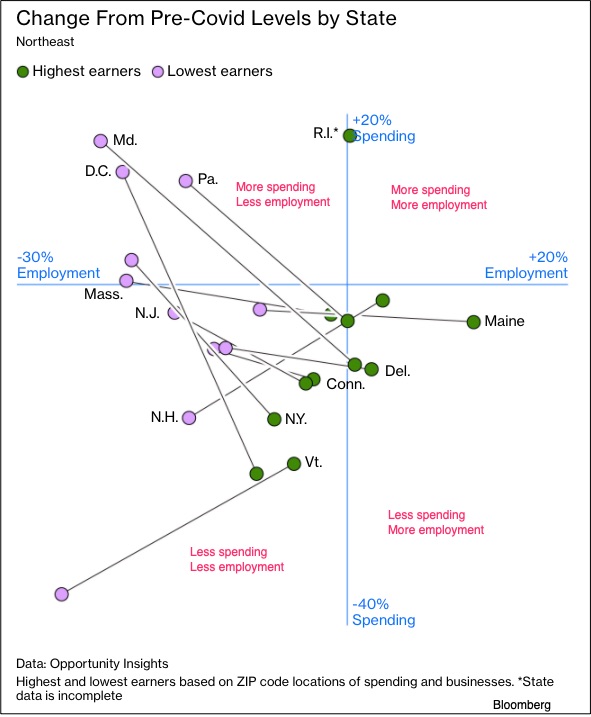
In the following graphic, summarizing statewide data, we see that New York State’s highest earners (green) are in the lower left quartile with less spending and less employment. Meanwhile, the state’s lowest earners (violet) have fewer jobs but are still spending. (I added the red quartile labels.):
The big data also showed us that the top income quartile spent much less during the beginning of 2020 but the bottom income quartile did not:
Completing the big data picture, in-person services spending massively declined:
Small Data
However, when researchers looked at smaller real time “street corner” data that included credit and debit card spending and small business revenue, the situation looked somewhat different. It all depended on the neighborhood. If affluence was high, then small businesses fared poorly.
Below, lighter blue areas on the left side correspond to the darker shaded areas in the map to the right. In other words, we have a connection between more income and less small business revenue:
After small business revenue plunged approximately 70 percent in affluent neighborhoods, storeowners responded by furloughing and firing their employees. Because they provided the pricey on-site goods and services that health conscious consumers were avoiding, many closed permanently. Meanwhile, the situation was less dire in lower income neighborhoods where businesses felt less of a shock.
The differences between big data and small data return us to the CARES Act. The Opportunity Insight researchers calculated that the Paycheck Protection Program loans increased employment at small business by just 3 percent. Bypassing the hardest hit households, the program appears to have spent $289,000 for each job it saved. Indeed, the “small” data indicate that social insurance rather than business loans could have been more beneficial.
Our Bottom Line: The Pandemic Recovery Alphabet
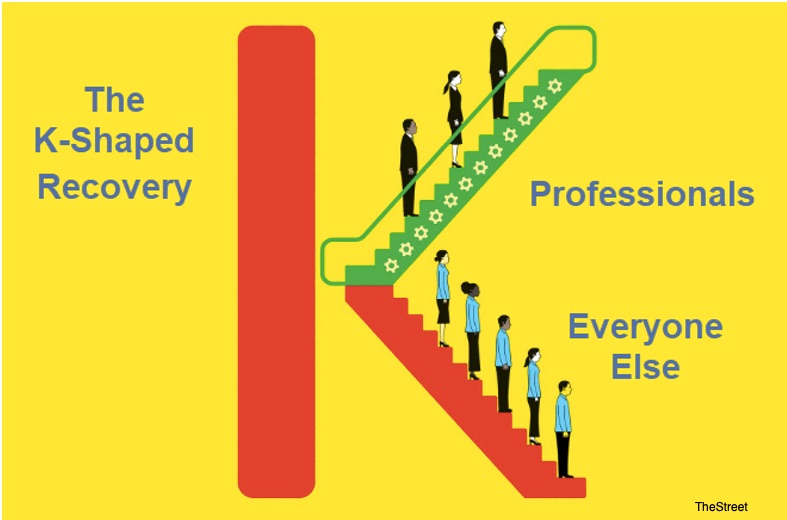
In the past, we’ve looked at the different letters that could illustrate the shape of a COVID-19 economic recovery. The possibilities included a “V,” a “U,” a Nike Swoosh:
When we look at street corner data, the K becomes much more evident.
My sources and more: For a closer look at the economic recovery (or lack thereof), this Bloomberg article and an Opportunity Insights paper from Raj Chetty and his colleagues had an extensive array of big and small data.


