![econlifelogotrademarkedwebsitelogo[1]](/wp-content/uploads/2024/05/econlifelogotrademarkedwebsitelogo1.png#100878)


Why Purell is More Than a Hand Sanitizer
May 31, 2020
The Reopening Role of the Restroom
June 3, 2020
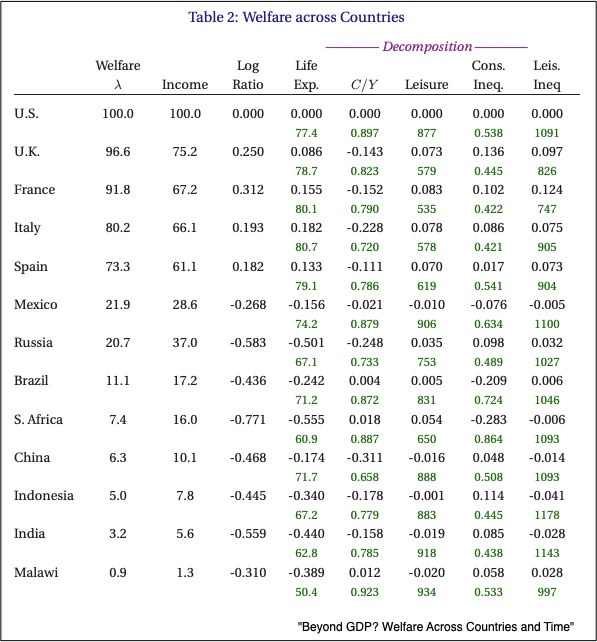
Two Stanford University economists decided to base their calculation of our welfare on variables that relate to how long we live, how much we work, and inequality. They then used their welfare calculations to change our perception of a country’s per capita GDP (the per person value of goods and services produced).
France, for example, has had a much smaller per capita GDP than the United States. But, their life expectancy was longer, and the hours they worked were shorter. So, the authors of this study concluded that both countries’ welfare was much closer than shown by their per capita GDPs.
Where are we going? To the Stanford study and then deciding what welfare means.
Comparing Welfare and the GDP
According to data from 13 countries, welfare considerations can change our perception of per capita GDP differences. It does though matter if the country’s economy is developed or developing.
Below are some per capita GDP (the income column) and welfare totals. The welfare scores between the U.S. and the next four countries are closer than the per capita GDP differences. For Mexico and Russia, though, the welfare “scores” pull them further down:

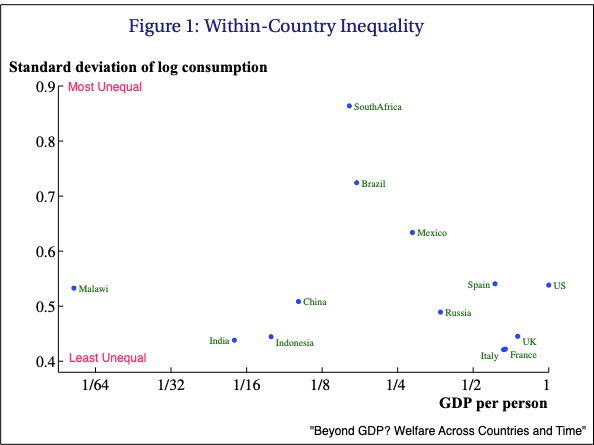
Inequality
When we just spotlight the inequality component of welfare, then South Africa tops the others, with Brazil and Mexico next. Meanwhile, Italy, France, and the U.K. are positioned at the bottom, displaying relatively less inequality:
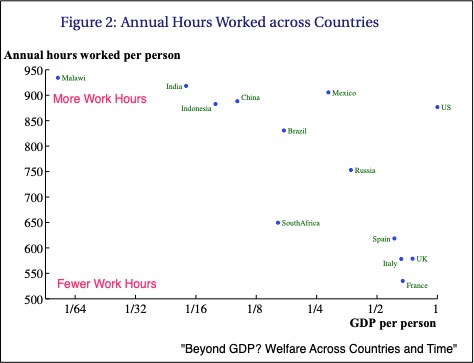
Leisure
For leisure also, France, Italy, Spain, and the U.K. score high on the welfare scale:
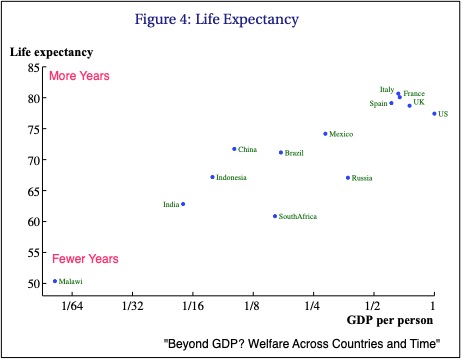
Life Expectancy
People can expect to live longer in Italy, France, Spain, and the U.K. than in the U.S.:
A Summary
By comparing welfare scores between the U.S. and other countries in this summary chart, you can see where GDP/Income differences become less meaningful and where they grow larger:
Our Bottom Line: Welfare Indices
Although this Stanford study used data from 2005 in a 2015 NBER paper, still the ideas resound. We continue to debate whether the GDP is a yardstick of our economic health. (I actually like the GDP but many people disagree with me.)
Since we “treasure what we measure,” do take a moment to decide the metrics you would select. In the OECD Better Life Index, first you choose your variables.
This is their full list which they then break down into more specific standards:
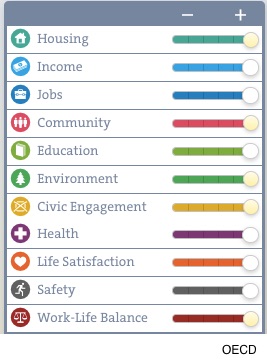
Next, you can apply them to any or all of the countries they include. The exercise lets each of us decide whether we agree with the welfare categories in the Stanford study. We also can consider if they change how we perceive the GDP.
My sources and more: For much more about the Stanford study, do read their NBER paper. Then, if you want to ponder how the GDP might change, I suggest the Stiglitz Report.
Ou featured image is from Pixabay.


