We’ve looked at the Big Mac Index. Now we have one for LEGO.
They are somewhat similar.
The LEGO Index
Looking at 200 countries and eight popular LEGO sets, the Toy Zone tells us where they cost the least and the most.
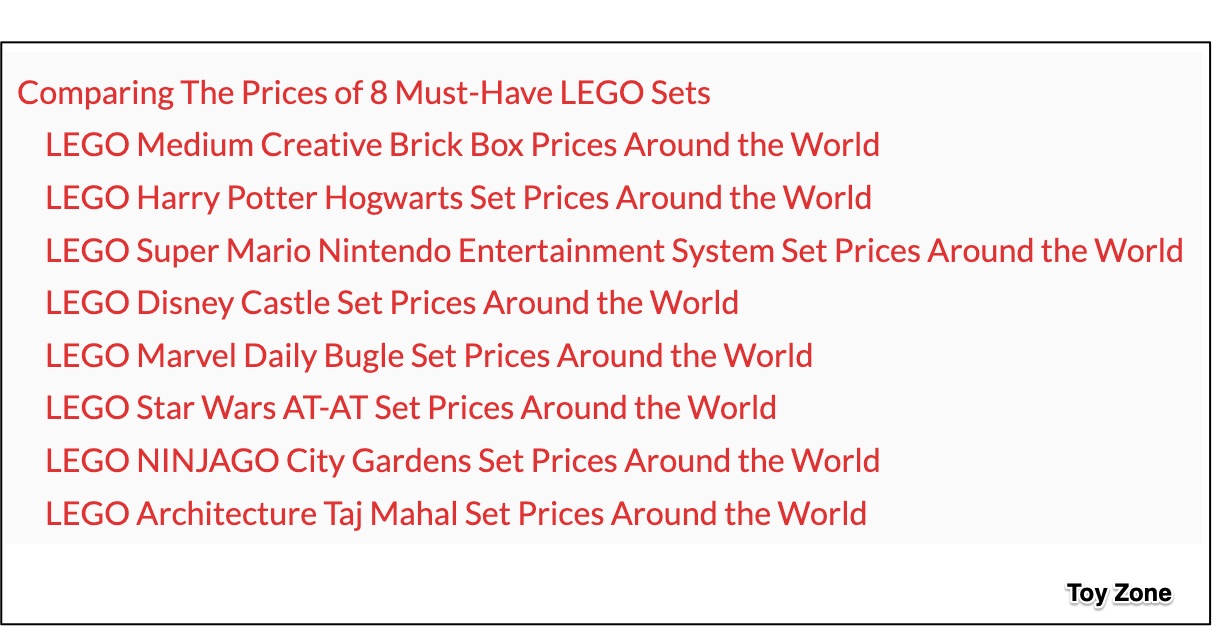
These were the sets they looked at:
Average LEGO prices range from a low of $269 in Belgium to a whopping high of $2,270 in Argentina. In Denmark, where LEGO originated, the average price, at $287, is the fourth cheapest in the world. Meanwhile, the average U.S. price is $349, Canada’s is $294, and Mexico, $447.
This map has all of the data. Yellow icons display the lowest prices and green, the highest:
Our Bottom Line: Purchasing Power Parity
Moving from country to country, and seeing different prices for the same goods, economists have asked how to compare income statistics. To get some answers, they calculate purchasing power parity (PPP). Described as a common currency, PPP requires that we figure out how much of Nation A’s currency we need to buy the same basket of goods and services in Nation A and Nation B. Then, we compare the two. As in the following graphic from the World Bank, the results let us create a fraction through which we wind up with a common currency.
Below, we start with a basket of goods and services that cost $50 in the U.S. Based on the exchange rate (7.26), they should sell for 363ZAR (South African Rand). However, because they are selling for 239ZAR, $50 USD can buy much more. So, we create the fraction 239/50, and get 4.77 as our South Africa to the U.S. PPP.

Even using similar calculations with LEGO, we can compare everyone’s GDP.
My sources and more: Thanks once again to Marginal Revolution for alerting me to another interesting story. But if you want much more, the Toy Zone has it all in maps and prices and LEGO sets. From there, it made sense to compare LEGO with the Big Mac Index and to review this perfect explanation of purchasing power parity (PPP).


