Several weeks ago, we looked at how five letters or the Nike Swoosh could describe the shape of the U.S. economic recovery:
Now we need to add a K.
The Economic Recovery Alphabet
When researchers from Opportunity Insights took a look at real time data on spending and jobs, they wound up seeing the massive economic dichotomy that the pandemic created.
Spending
We know that consumers are spending much less. Upper quartile households cut their spending by 17 percent while those in the lowest quartile cut back by 4 percent. The key though was why. With stock market indices soaring, home values rising, and college educated consumers able to work from home, upper income households were faring fine. They were shopping less because of safety considerations–not the lack of income that constrained the lower quartiles.
Employment
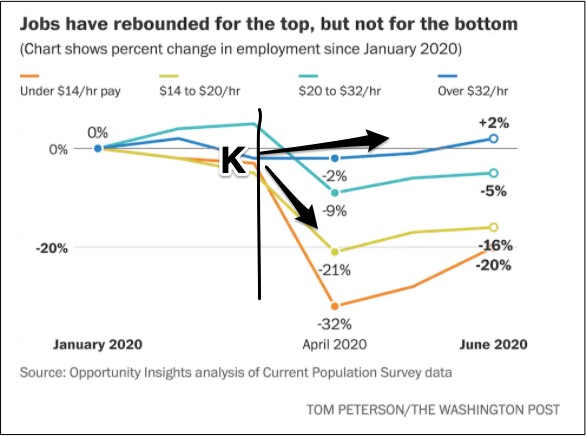
Millions of credit and debit card transactions indicated that people were spending less in wealthier neighborhoods. At businesses that involved person-to-person contact, lower income employees lost their paychecks. The result was an employment dichotomy between rich and poor, and white and minority, that has created a “K” recovery with one group up and the other still down.
Below you can see that $32/hour jobs dropped less and returned more than those paying less. It sort of looked like the “K” that I tried to illustrate with my arrows:
Stimulus
CARES Act stimulus checks helped to restore spending. But because small businesses in affluent areas minimally benefited from the cash infusion, their low income employees remained vulnerable. The facts suggest that social insurance rather than a reopening mandate is what households need until consumers feel safe.
Our Bottom Line: GDP
As economists, we can look at the coronavirus impact through a GDP component lens. Among the GDP’s four components, personal consumption expenditures best displays the impact of the coronavirus pandemic:
GDP components also reveal a divided economy that resembles a “K.”
My sources and more: The Washington Post has the explanation of the “K” recovery as did AXIOS. However, this paper from the Raj Chetty/John Friedman group at Opportunity Insights had a vastly wonderful array of facts and even business activity maps for NYC and beyond.


This was an interesting new way to look at this! I’m a high school student and find this blog fun and pleasant to read (my other favorite for economics is Marginal Revolution and for law SCOTUS blog). This blog really helps bring in theoretical concepts to real-world situations. Thank you for fun pieces every day!
Thanks for letting me know, Kaitlin.