Geography, history, age, education, and income can determine what we spend on food.
Food Spending
Geography
Comparing at-home food expenditures, we see a pretty consistent national income correlation: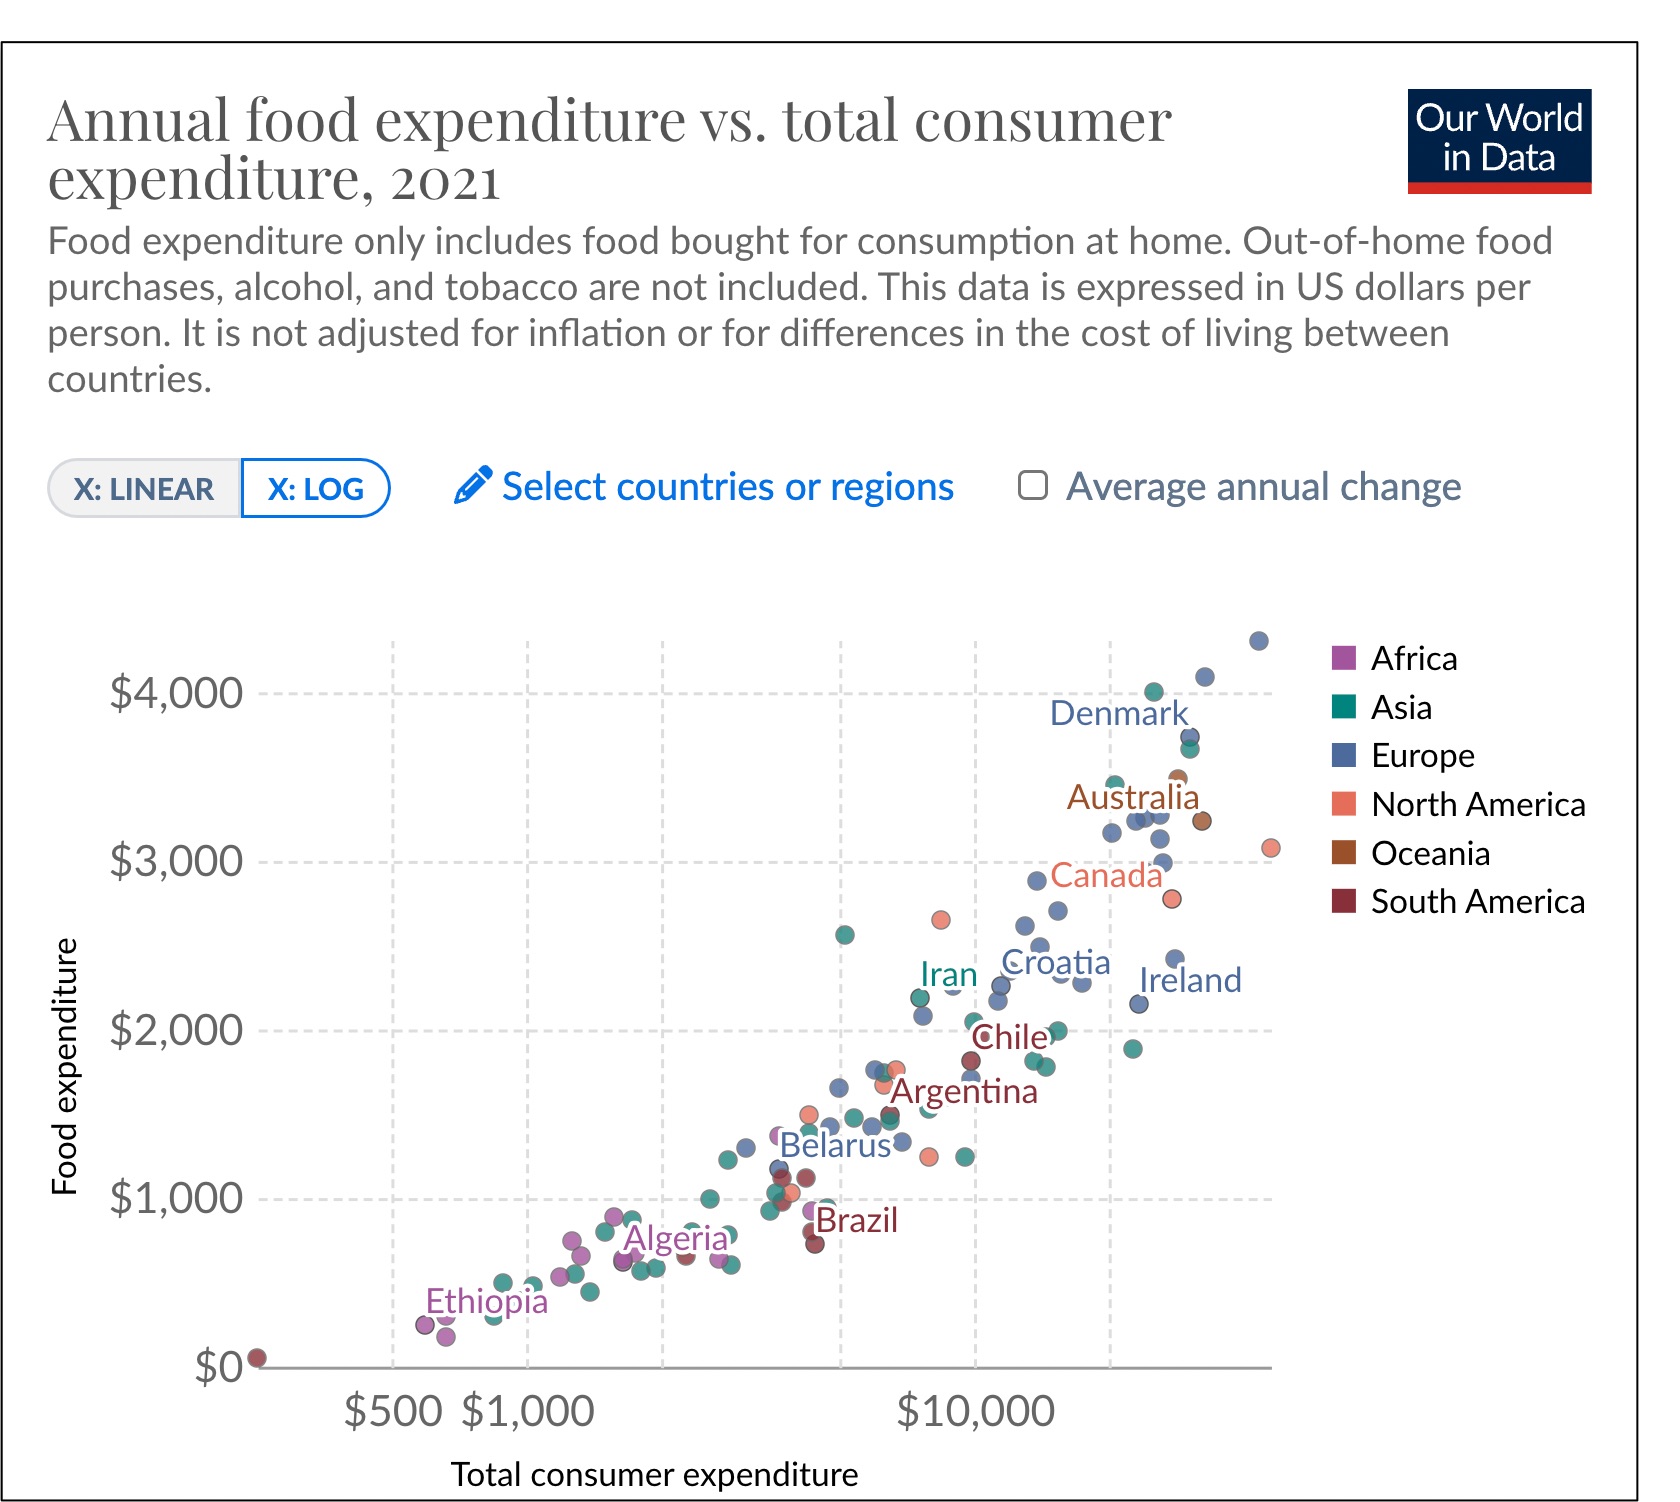
History
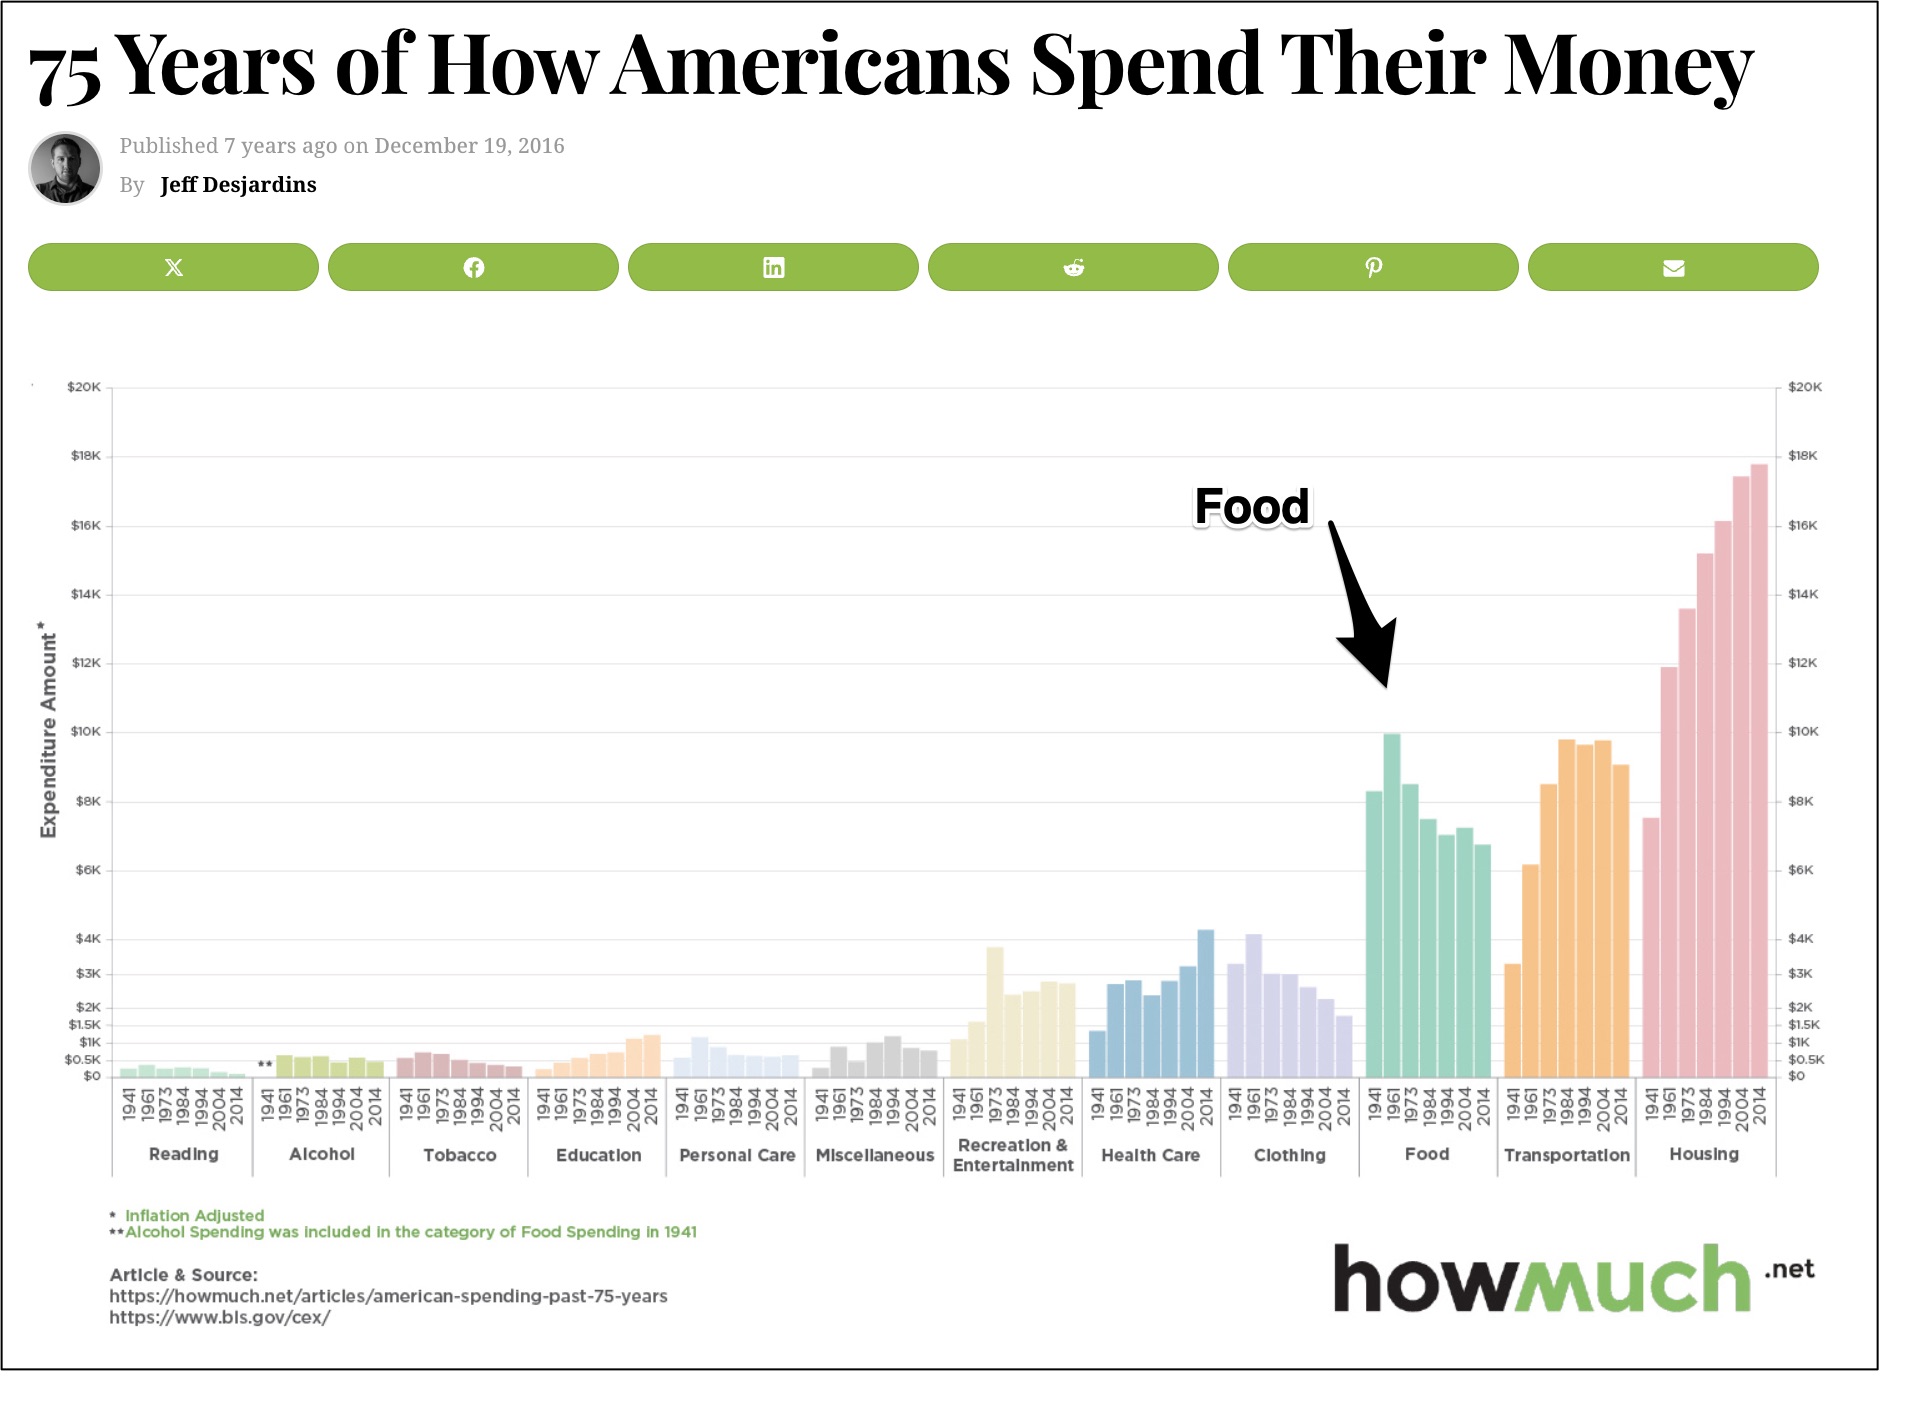
Rather than where, if we look at when, we see that food has occupied a smaller slice of our spending pie than 75 years ago:
Age Differences
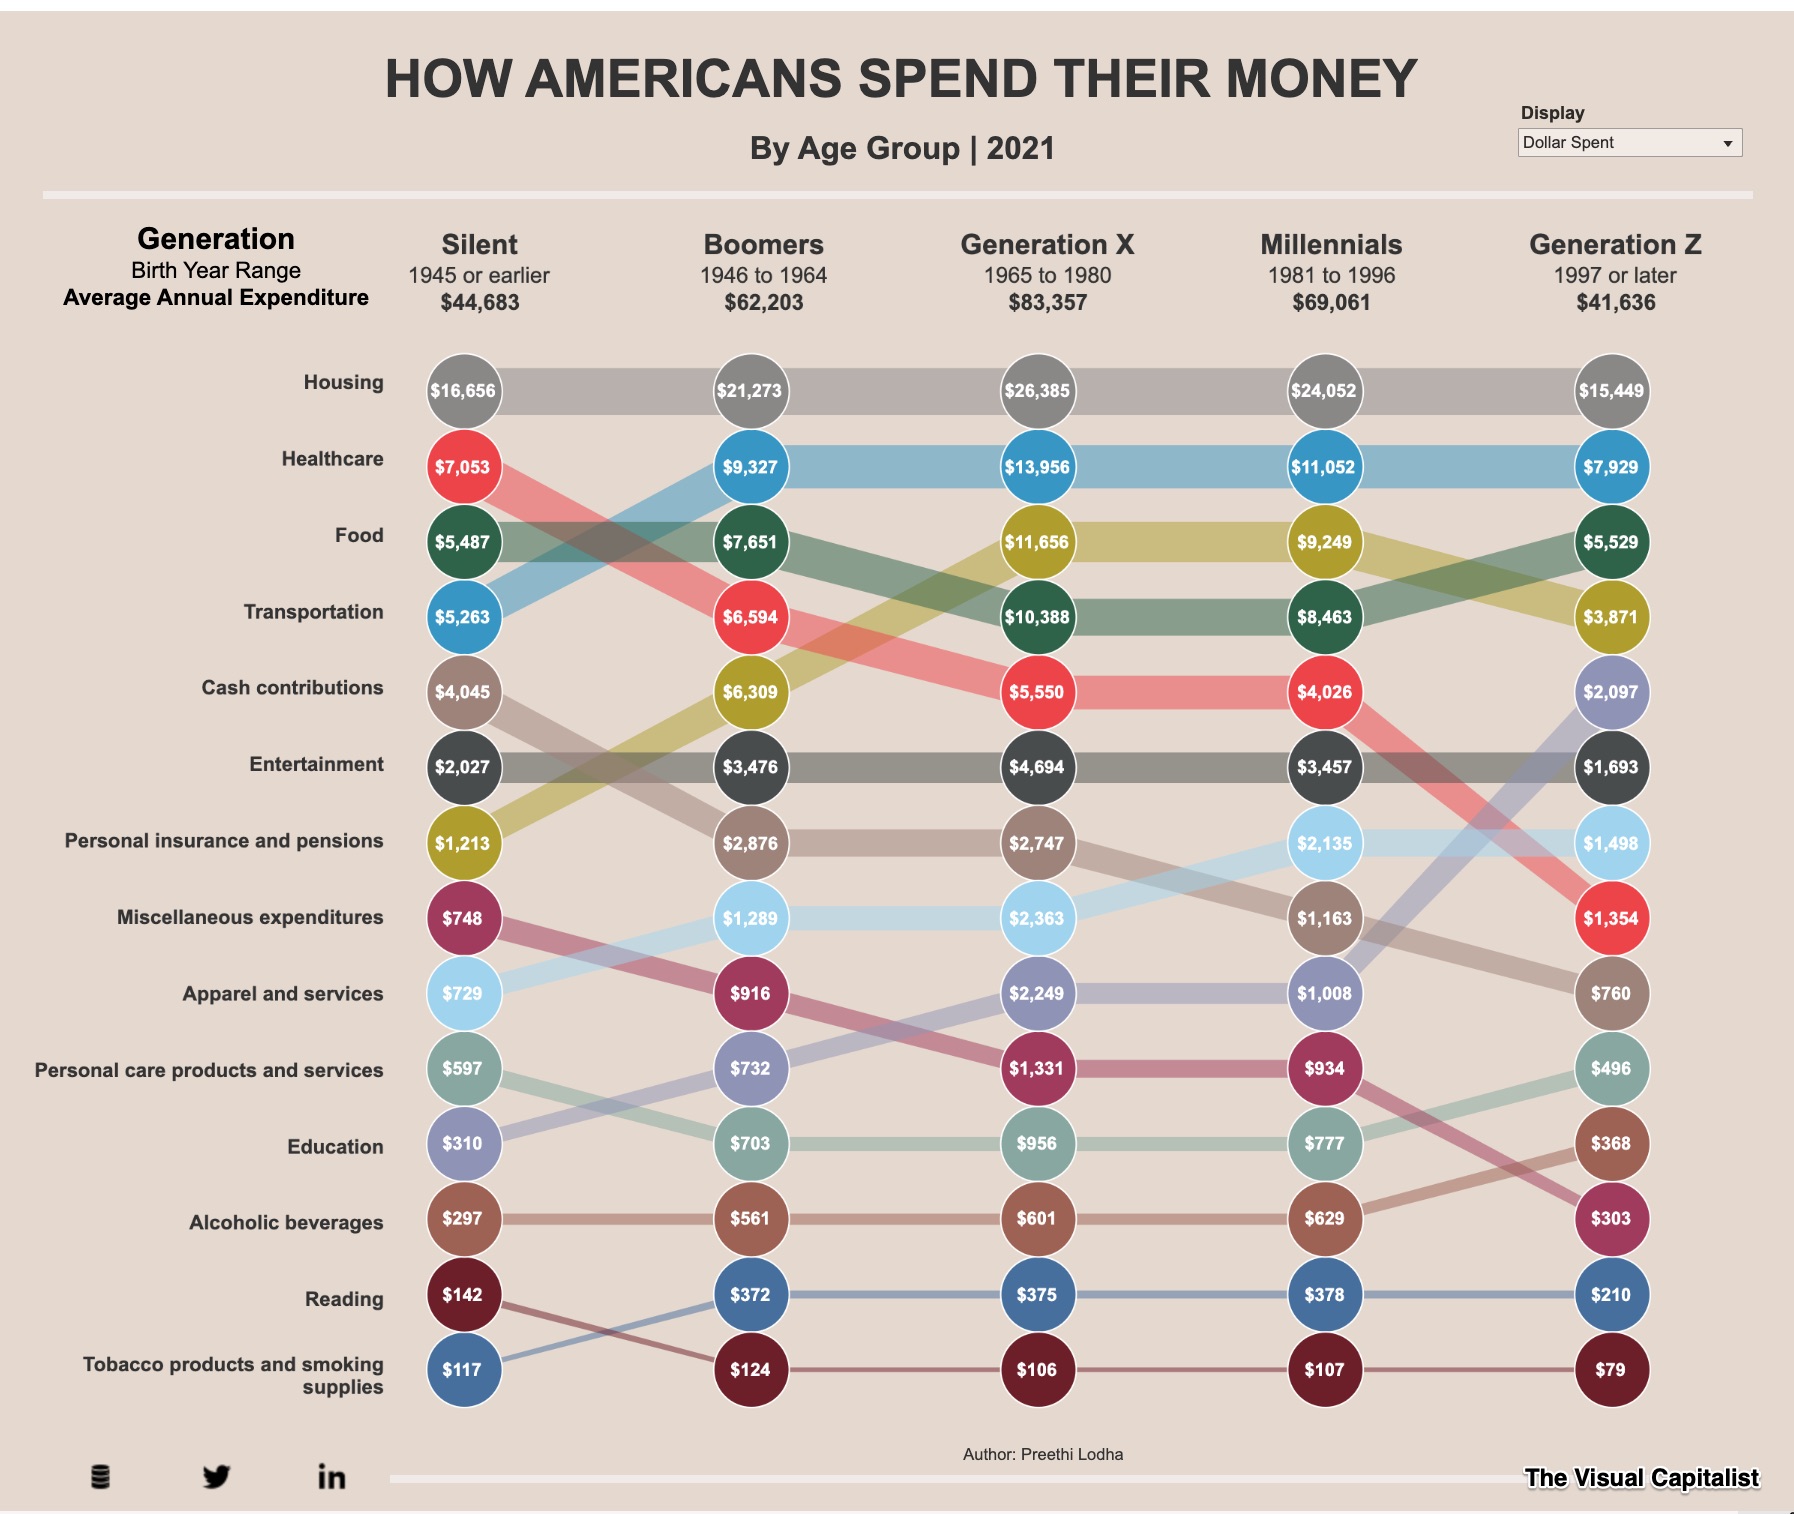
As the third item (below) among our household spending categories, food is highest for Gen X but #4 on their list. However, while the amounts are smaller, food occupies a larger proportion of the Silent Gen and Boomers’ spending.
Education and Income
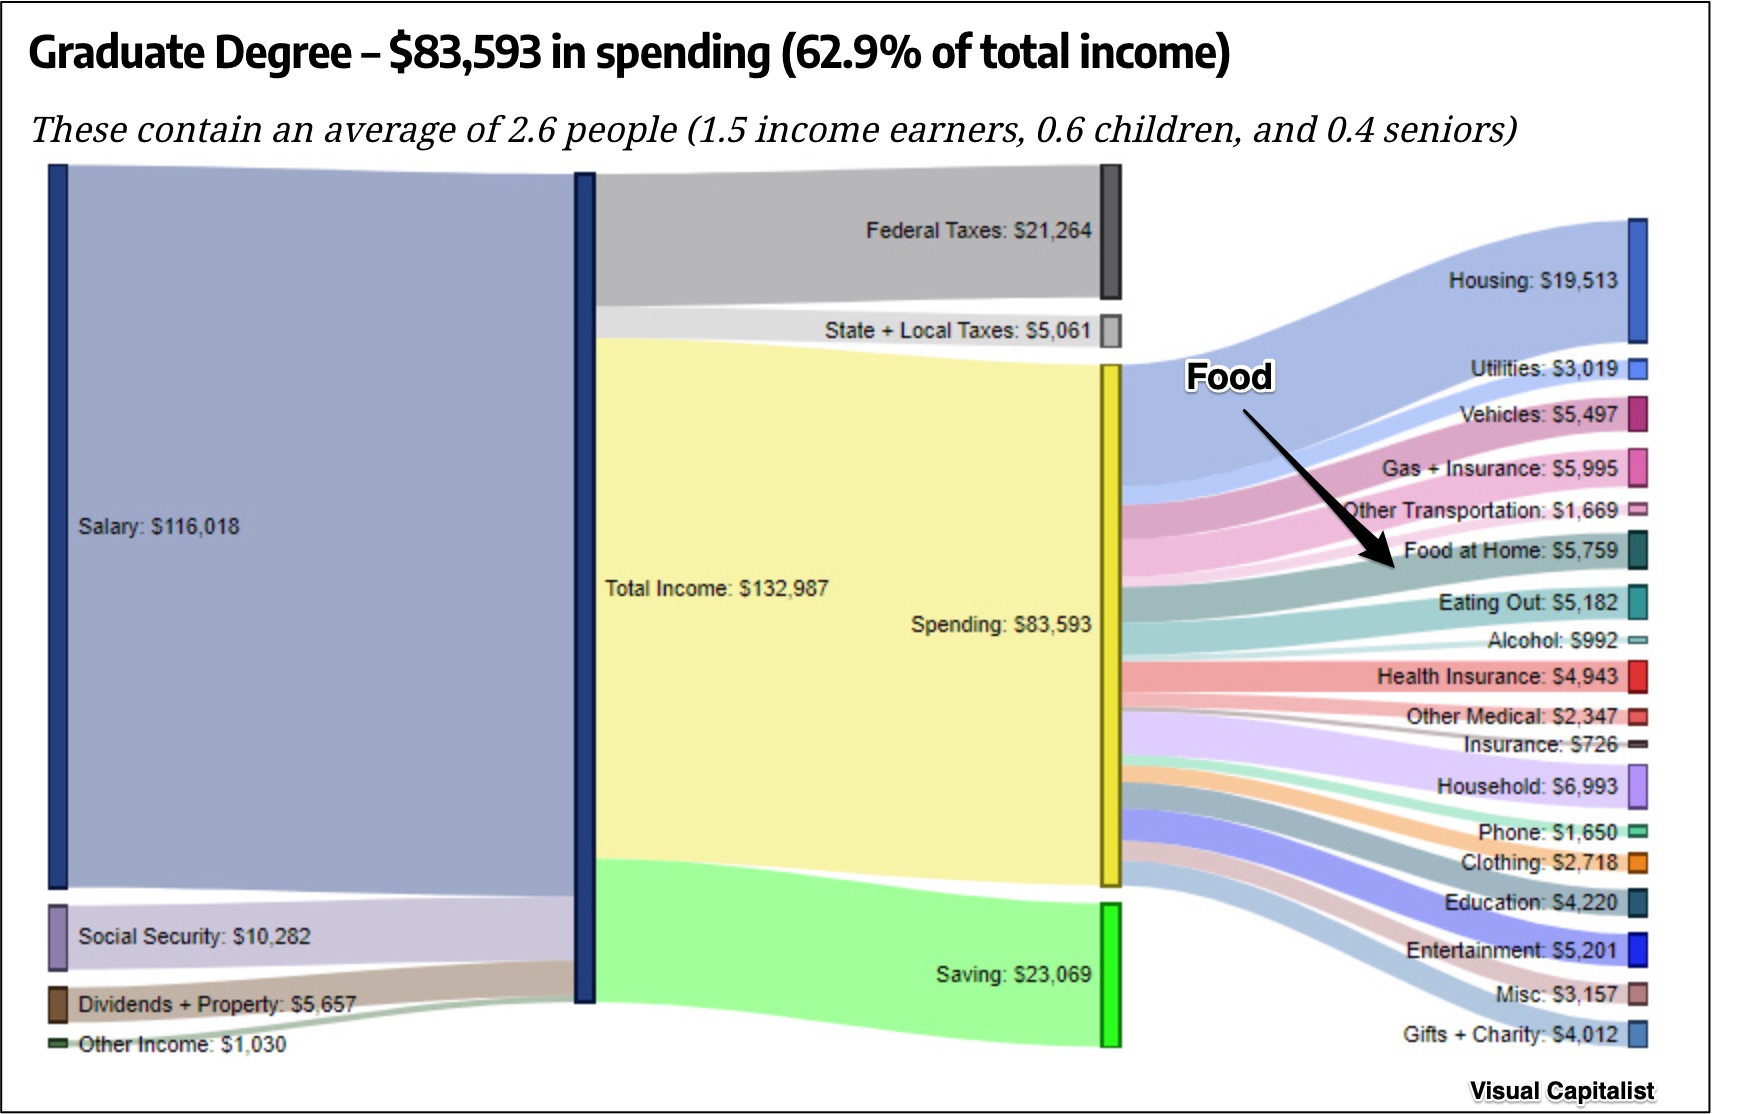
At 6.9 percent, the at-home food spending by our most educated cohort, at $5,759, is close to other expenses:
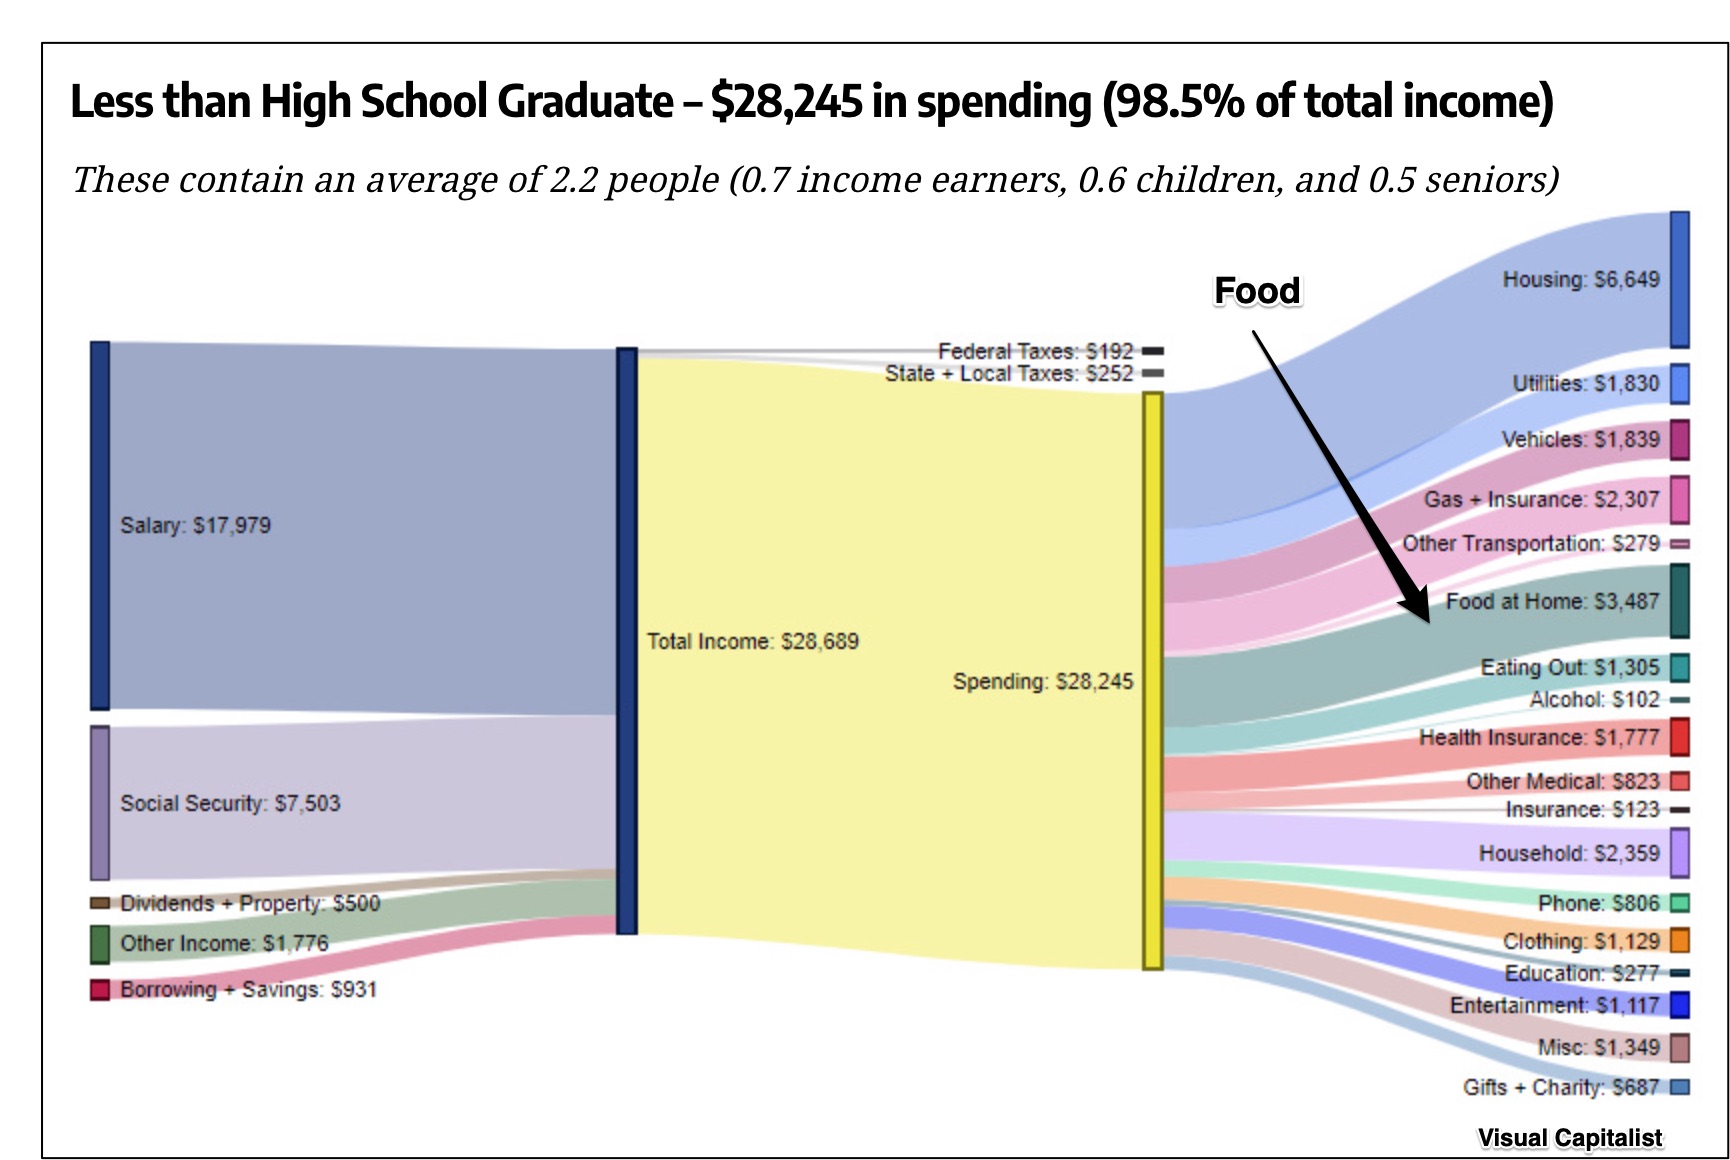
By contrast, the least educated and lowest earners, at $3,487, spend the highest proportion of their income, except for housing, on at-home food:
Our Bottom Line: Engel’s Law
Looking for a spending thread, Engel’s Law gives us some answers.
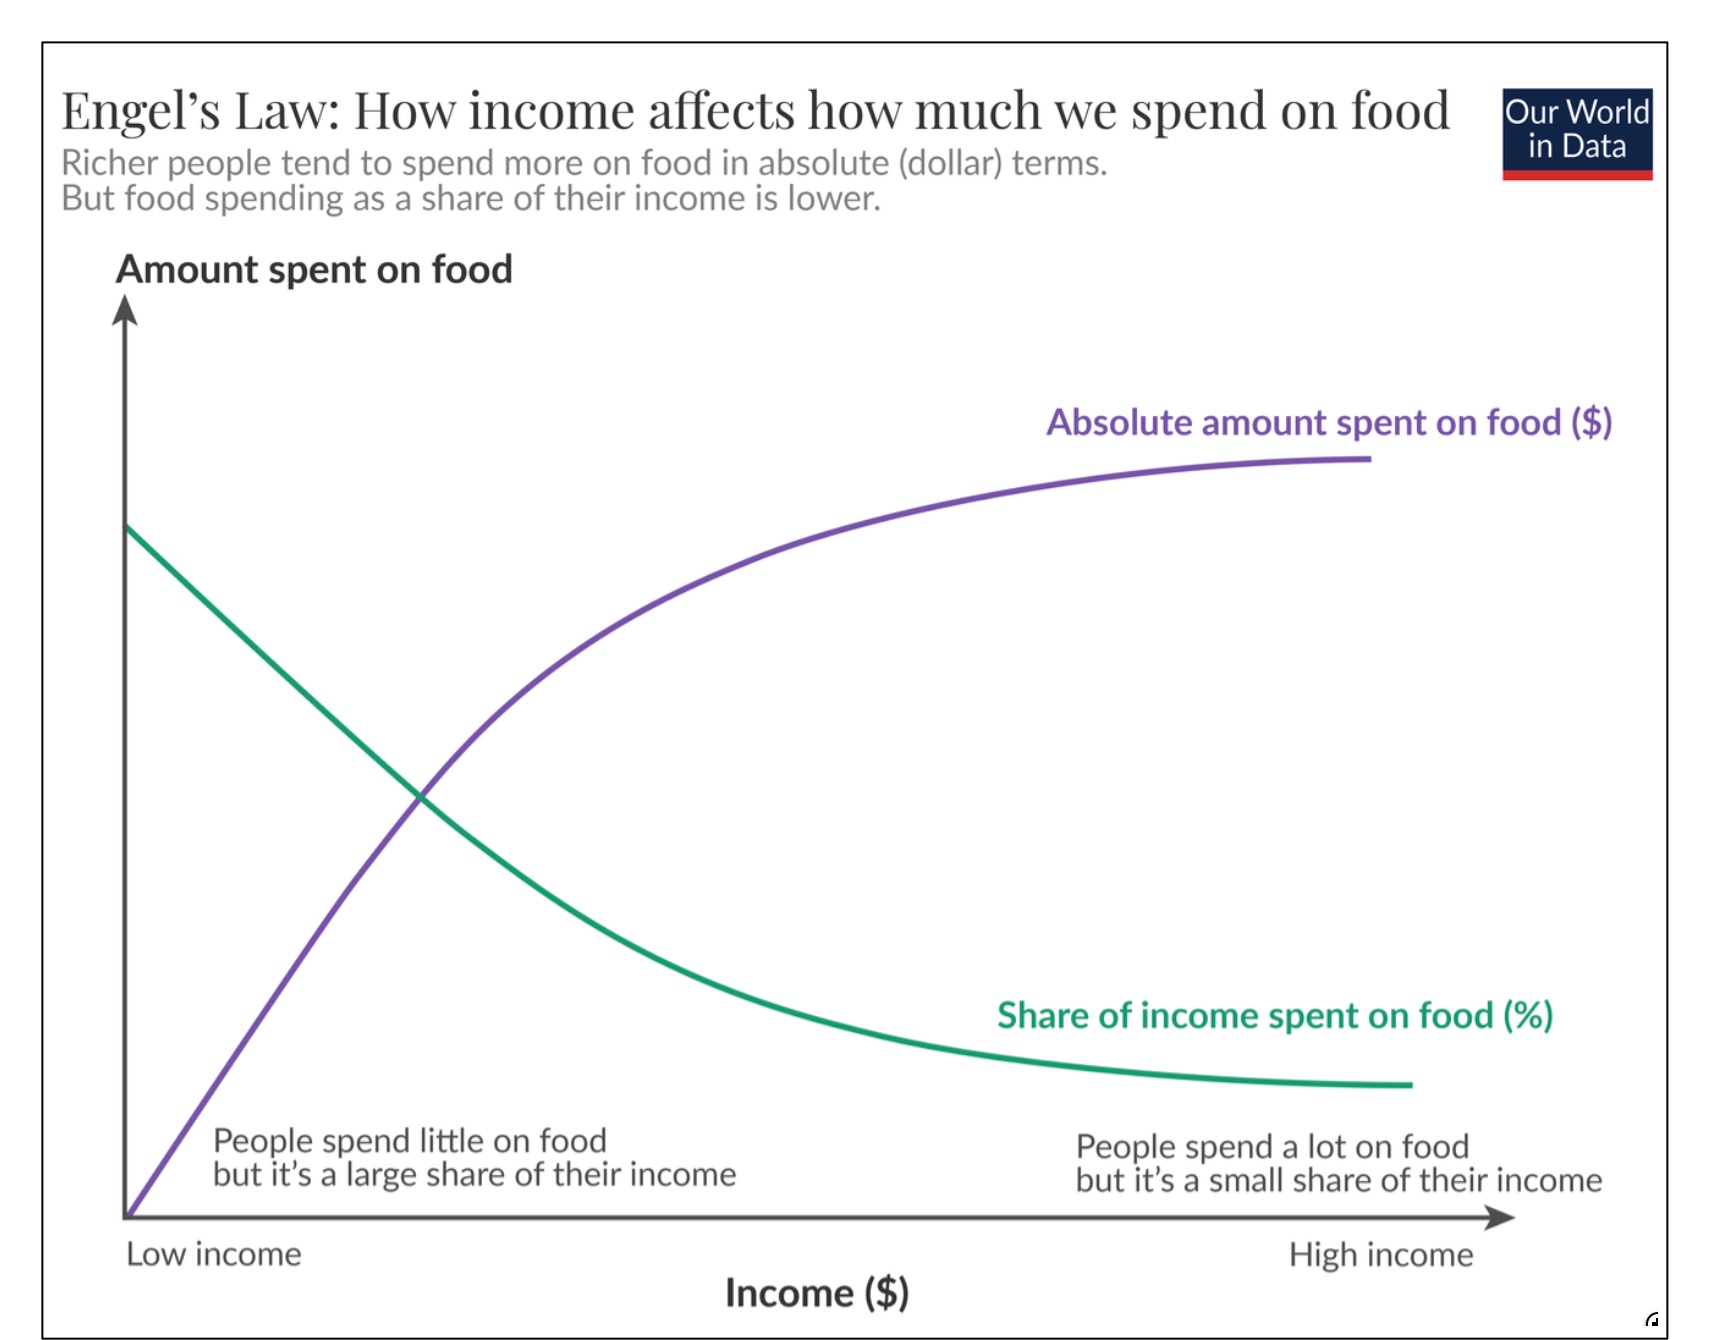
Engel’s Law tells us that while higher income households spend more on food, it occupies a smaller proportion of their total consumer spending. As a result, shown in our geography and income graphics, lower income correlates with less food spending. Also though, in lower income households, food spending is relatively higher. In addition, the food menu changes. When consumers spend less on food, they tend to have less varied, less healthy diets that rely on cheaper crops like cereals and tubers. Then, with more affluence, we add, fruits, vegetables, and meats.
An Engel’s Law graph is so wonderfully uncluttered and clear:
My sources and more: Thanks to WEF for inspiring today’s post. That took me to the graphics at the Visual Capitalist, here, here, and here. Then, as a final stop, Our World in Data had the closer look at the geography of Engel’s Law. And finally, with a different perspective, we looked at the global food supply in this econlife post.


