The Washington D.C. region is one of the most affluent areas in the United States. Way above the national median, its real GDP per capita far exceeds Mississippi’s.
The United States is not alone. The International Monetary Fund recently took a look at the economic divide inside 20 advanced nations.
Lagging Regions
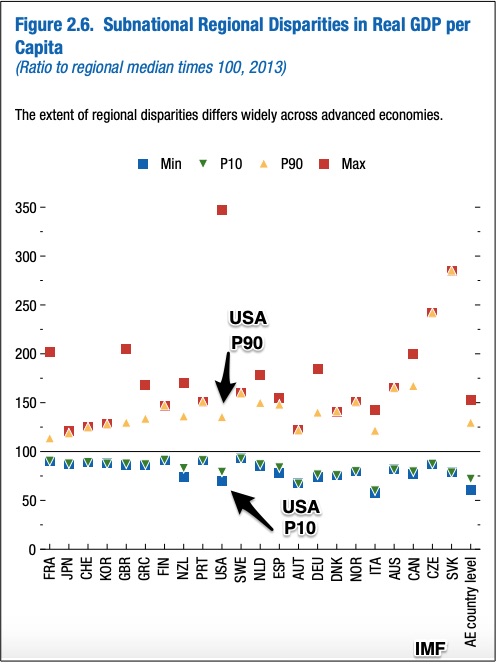
With gains in certain areas and stagnation elsewhere, advanced economies display economic divergence. In the graph below you can see that the difference between the 90th percentile (P90) regions and those in the 10th percentile (P10) lagging regions varies. The per capita real GDP gap in France (P10 compared to P90) is much smaller than for the USA:
If we ask where, we wind up with the same industries that lag and lead. Yes, it’s manufacturing, mining, and agriculture that constrain local GDPs. So too have less educated workers who are younger than prime age (25-54). When technology replaces people, those laborers remain rather than migrating to more vibrant and innovative regions where occupations tend toward technology, finance, law, design, and hospitality.
As for why, it’s trade and automation. Whereas Germany is an example of a nation benefiting from trade with China, areas of the U.S. have suffered more than most. For all nations, though, the IMF points out that the trade impact on a region is short term. Automation looms larger as a long term disrupter.
Our Bottom Line: Per Capita GDP
We can get a snapshot of wealth through the GDP. As a yardstick with Consumer Spending, Investment primarily from businesses, and Government Spending as its major components, the GDP is the dollar value of the goods and services we produce. Then, if you divide it by the population, you get the per person GDP. And beyond that, you can look at the median–the middle amount.
Per Capita GDP for an entire country and its median GDP can be misleading. Instead, by looking at regional differences in a country, you can get a better picture of a nation’s affluence.
According to the IMF, you also get a better grasp of why the world’s economic growth is slowing to 3 percent.
My sources and more: Thanks to the Planet Money newsletter for alerting me to the new IMF Report.


