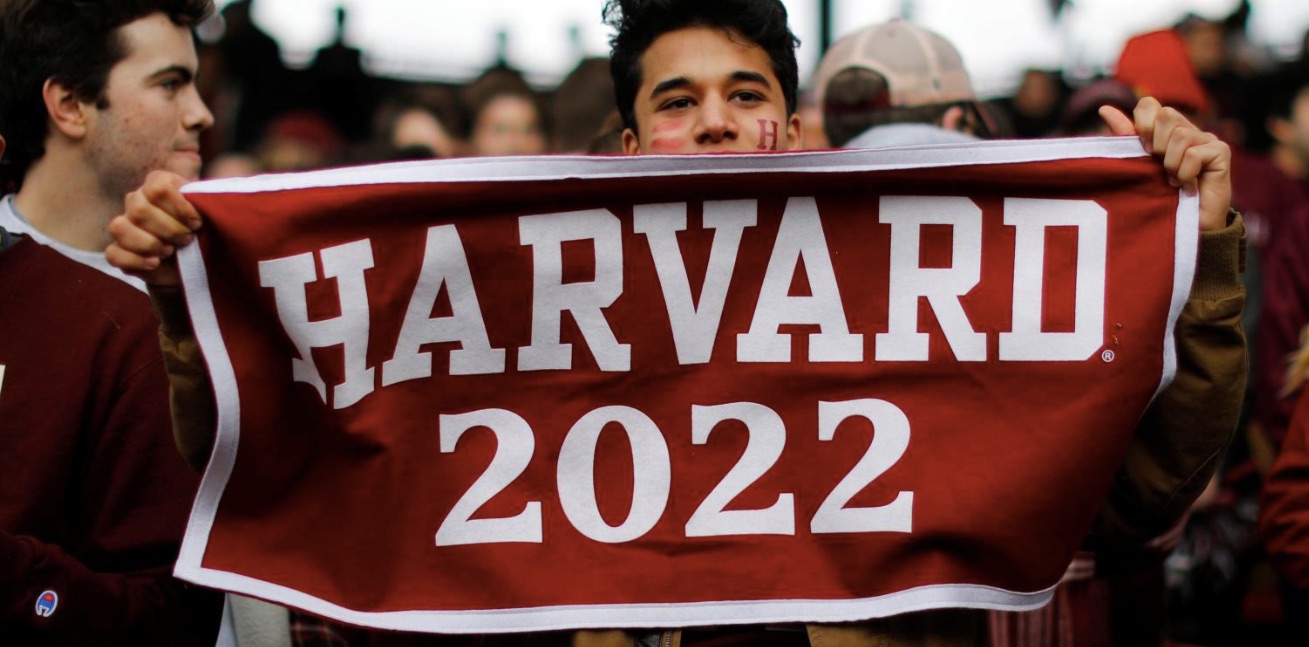
At highly selective schools, 2019 college admission rates were pretty low:
- Harvard: 4.5%
- Yale: 5.91%
- Stanford: 4.3% in 2018 (They are no longer releasing the number.)
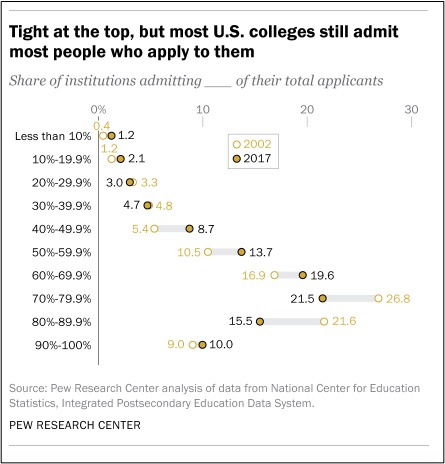
But we are looking at a tiny proportion of the higher education population. At 3.4 percent of all schools, those at the top accounted for 4.1 percent of total school enrollment. Almost everywhere else, colleges accepted most of the students that applied.
After looking at 1,364 four-year colleges and universities in 2017, a Pew Research survey concluded that most colleges admit most applicants. These were the numbers for 2019:
One event had a considerable impact on these numbers. While students call it the Common App, an economist might say it’s all about friction.
The Impact of the Common Application on College Admissions
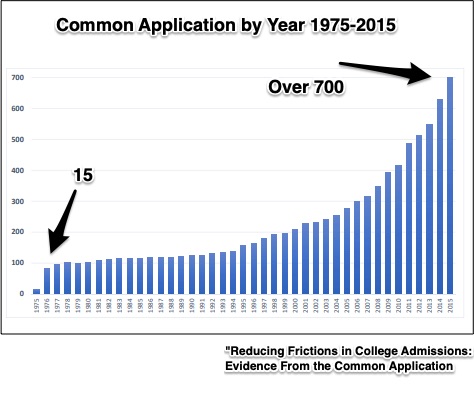
In 1975, one event was destined to transform the entire college applications experience. Offered for the first time by 15 schools, the Common Application made life much easier for college seniors. Instead of filling out separate forms for every school they applied to, students used just one for Common App (CA) schools.
Quickly, the CA became more popular among colleges. Now, institutional participation is closer to 800 and the system processes close to four million applications for one million students:
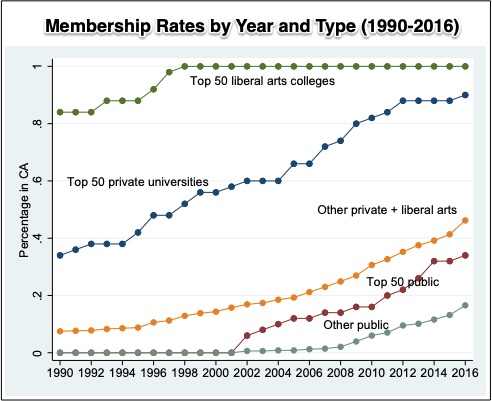
As for the types of schools that use the CA, the most selective private institutions were the first and still are dominant. Then, followed by public schools, those that are less selective joined the network:
Because of the Common App, the proportion of acceptances went down and the number of applications went up. So even when schools accepted more students, they still could proclaim a lower “yield” (lower percent getting a yes) that meant a higher U.S. News rank. As for any change in selectivity, the results have not been conclusive.
Meanwhile, schools wound up with more diversity. Since additional applications came from far off places, they accepted more out-of-state and foreign students. Also though the divide between more and less selective schools widened.
The new incentives created by the ease of filling out one form rather than many had the impact we would expect. More students applied to more schools, near and far. They had more safety schools and more of a choice.
Our Bottom Line: Friction
Just like physics, friction slows economic transactions. My favorite example of friction is the CVS message to callers. Making it tough to access a person, you wait for a hierarchy of instructions until the last one says you can talk with the pharmacy. That friction slows down the time it takes to order anything with a person.
Completely the opposite, the Common App diminished friction. College applicants needed to spend less time and express less information because they had just one form. The result? Schools received many more applications.
My sources and more: In my monthly NBER Digest email which I recommend getting, I learned about the Common App study. (NBER gated version: Working Paper 26151), Then, Pew and this NY Times article completed the picture.
Please note that all graphs except for those from Pew came from the Common App paper. Our featured image is from Quartz.


