![econlifelogotrademarkedwebsitelogo[1]](/wp-content/uploads/2024/05/econlifelogotrademarkedwebsitelogo1.png#100878)


Why We Should Buy Popcorn at the Movies
September 11, 2019
The Ripple of a No Deal Brexit
September 13, 2019
Comparing $1.48 trillion to $1.46 trillion, student loan debt is more now than last year:

But we shouldn’t necessarily be worried.
In one experiment, community college students who were encouraged to borrow fared better academically than their debtless peers and those with smaller loans. The reason? The people who borrowed took more courses and got higher grades. Some could transfer to four-year colleges.
Scholars have hypothesized that larger loans led to more learning, better jobs, and the ability to repay debt.
Where are we going? To other consumer debt facts.
Little Known Debt Facts
How we borrow has changed a bit.
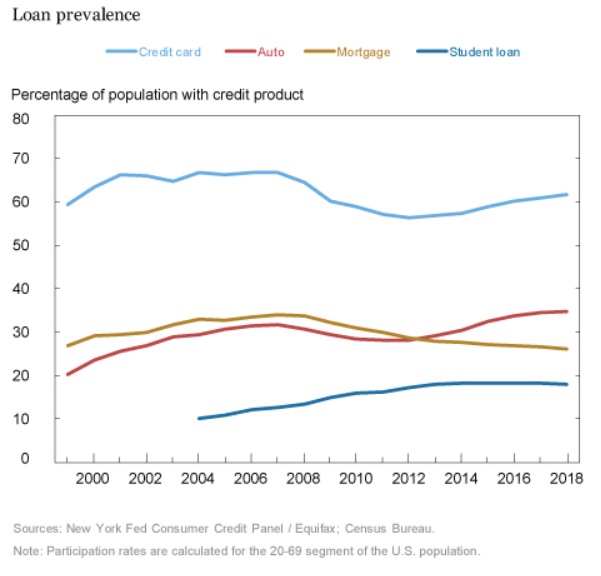
The credit products we use have shifted slightly during the past 19 years. Looking at the proportion of the population with a credit product, we see that auto loans display the biggest increase in consumer debt while mortgages are on the way down:
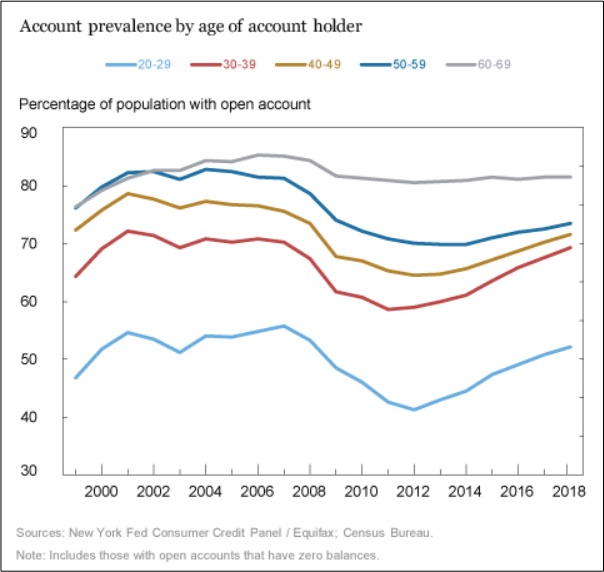
Our ages have changed too.
Particularly from 2008 to 2012, the proportion of people aged 20 to 29 who had credit card accounts dipped precipitously to 41%. One reason was 2009 Credit Card legislation that targeted abusive credit card practices. Now though the trend has reversed:
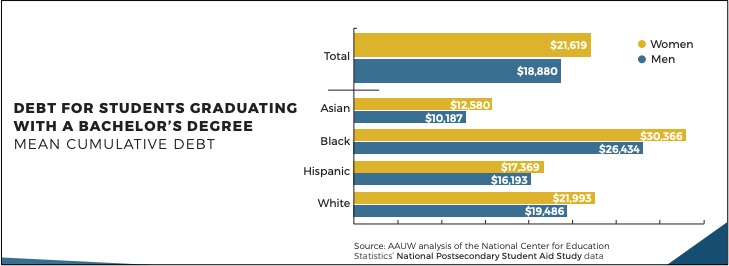
In the student category of consumer debt, women owe more than men.
Whether looking at the total or specific groups, women with bachelor’s degrees borrowed more than their male counterparts:
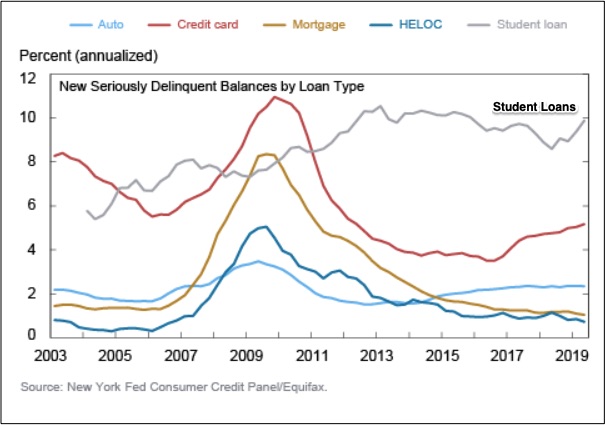
Compared to other kinds of consumer debt, student loan delinquencies are most noticeably up.
We are looking below at loans that transitioned into delinquencies that could be as long as 90 days:
Our Bottom Line: Consumer Spending
A loan represents the extra money that we have for consumption. When economists consider how we spend any extra money, they say they are looking at our marginal propensity to consume (MPC). Really though, we are asking what we tend to do when we have extra income.
Whether looking at our credit cards or what we borrow for school, for autos, and for our homes, it all tells us how we spend our extra money. It provides some insight about our MPC.
My sources and more: My go-to website for debt facts is the NY Federal Reserve’s Liberty Street blog. However, this summary from NBC also came in handy. After that, I recommend this paper from the NY Fed on the marginal propensity to consume an extra $500 to $5,000. And lastly (but actually initially), this NY Times Upshot column was the perfect intro for an overview of our response to student debt.
Our featured image is from Pixabay.


