For baseball teams and countries, we can calculate misery indexes.
So let’s take a look.
A Baseball Fan’s Misery
ESPN Misery Index
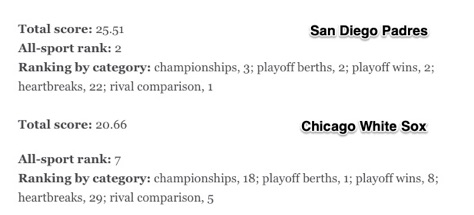
ESPN decided that they could calculate fan misery through five main criteria. The number of championships was important. But they had to be recent. Correspondingly, making the playoffs counts but even more so, winning the playoffs. Next, more emotionally, they consider the heartbreaks like a dismal performance in the playoffs. And finally, it’s whether you beat the big rival.
Yes, they churn in some other figures but those five were the primary considerations when they concluded that San Diego Padre fans were the most miserable, and then Chicago White Sox loyalists. The higher total score indicates more misery.
Below, I’ve looked at baseball. The “all-sport” rank covers all sports:
From there, moving “up” the scale of the most miserable fans, the Cincinnati Reds came after Chicago, and then the Seattle Mariners, Tampa Bay Rays, and the Milwaukee Brewers.
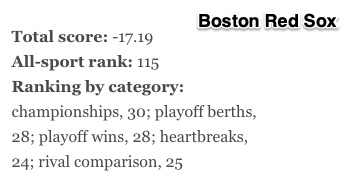
And of course, in a list of 30 teams, with a score of -17.19, the Boston Red Sox are #30 because they generate the least misery (and maybe considerable happiness):
Near the top also for happiness are the San Francisco Giants, at #29 and the Yankees, #28.
Team Value
And now for a bit of correlation.
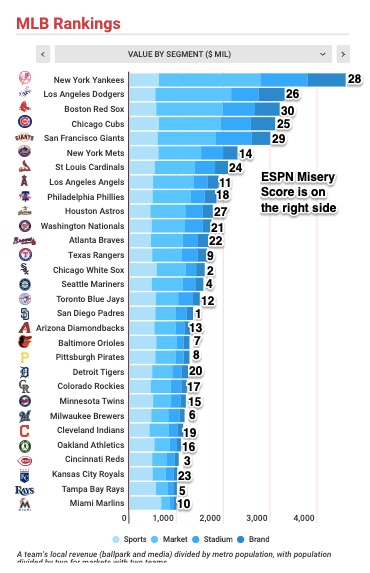
Let’s see how fan misery compares to team value. Below, I’ve used a Forbes ranking based on sports, market, stadium, and brand. Although there are some anomalies like the NY Mets, the highest valued teams tend to have the least miserable fans:
The World’s Misery
Economist Arthur Okun (1928-1980), created the first (country) misery index. By adding together the inflation rate and the unemployment rate, he had a measure of economic distress. I guess it makes sense that when purchasing power dips and joblessness climbs, there are fewer smiles.
The Most Miserable
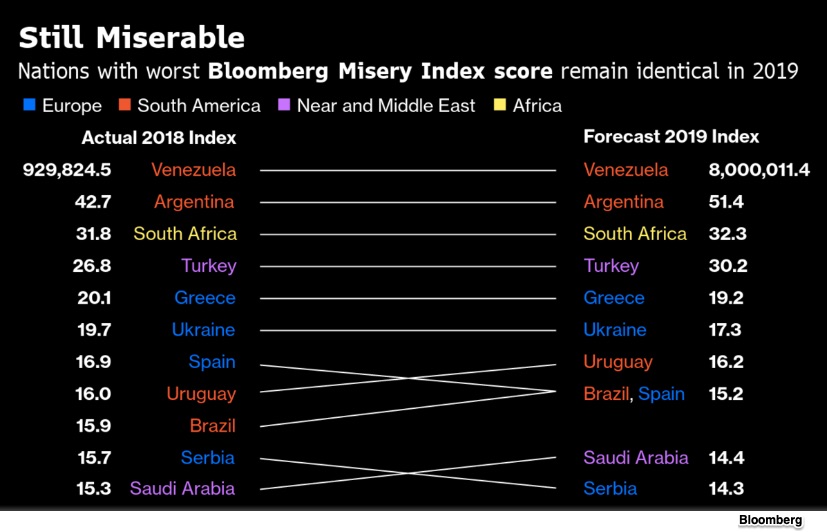
Venezuela is by far the most miserable country because of its hyperinflation:
At the other end of the scale, we have Thailand and Singapore topping the list of nations with low unemployment and low inflation:
Here I wondered if there was any correlation between the misery index and national happiness scores.
There was none
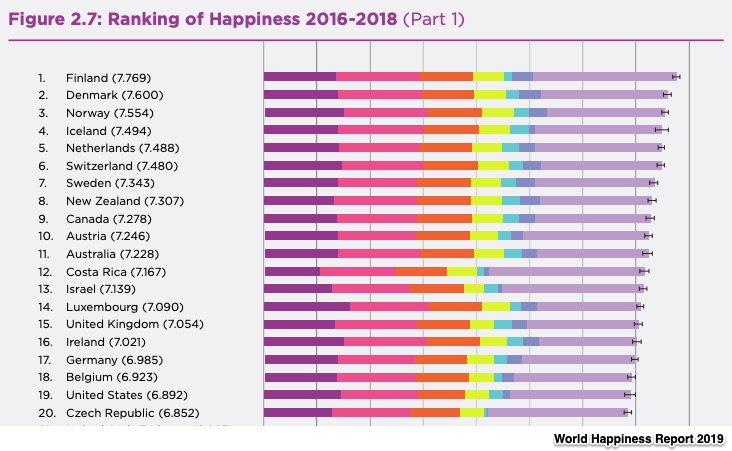
In the 2019 Happiness Report from the UN, the numbers from a Gallup survey again tell us we should live in a Nordic nation. These are the top 20 out of 156. Meanwhile, Singapore is #34, Thailand, #52 and Japan is even lower at #58:
 Our Bottom Line: Statistical Yardsticks
Ranging from misery to happiness and team value, numbers sound so very precise. And that is why we should be skeptical. No matter what we are quantifying, there is always a subjective component that reflects a human opinion.
So, what do misery indexes say about baseball and the world?
My sources and more: ESPN explained its Sports Miseryindex in this article and then applied it to MLB here. Lighthearted on the surface, for some of us, the ESPN Index does reflect true misery. As our complement, I used Forbes to assess team value. Then, Bloomberg takes us to countries with its misery Index as does the UN’s 100+ page happiness report.
Please note that several sentences from today were in a previous econlife post.


