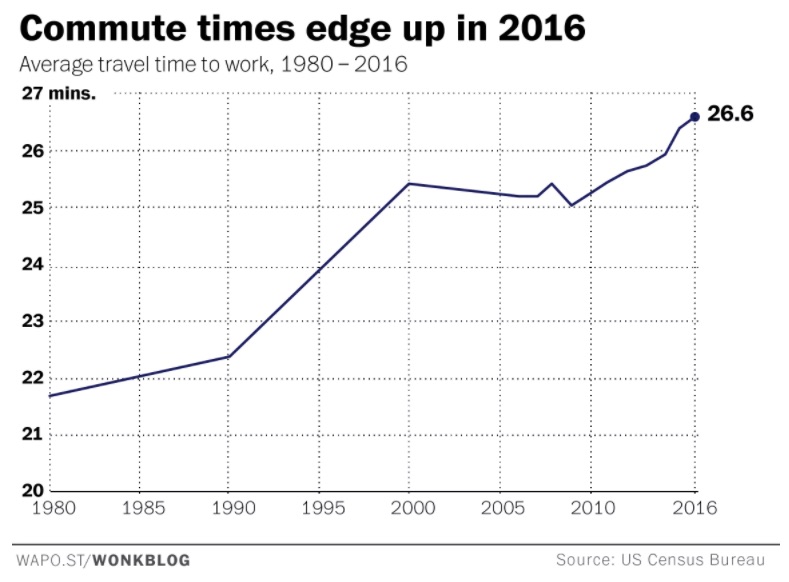
Average one-way daily commuting time in the U.S. was 26 minutes and 36 seconds during 2016.
As a benchmark though, those 26 1/2 (or so) minutes say a lot more.
How Long We Commute
Comparing the average to the past, we see increasingly longer commutes in the U.S. Looking back to last year, we are up by 12 seconds. Not much? It’s 1 hour and 40 minutes extra a year. Multiply that by the number of workers who commute and you get a lot of driving time.
Meanwhile, the difference between 2016 and 1980 is close to 42 hours more that each commuter sits in the car. One reason? We live farther from work. Those of us who spend from 60 to more than 90 minutes each workday, each way, is on the rise.
You can see the steady time climb below:
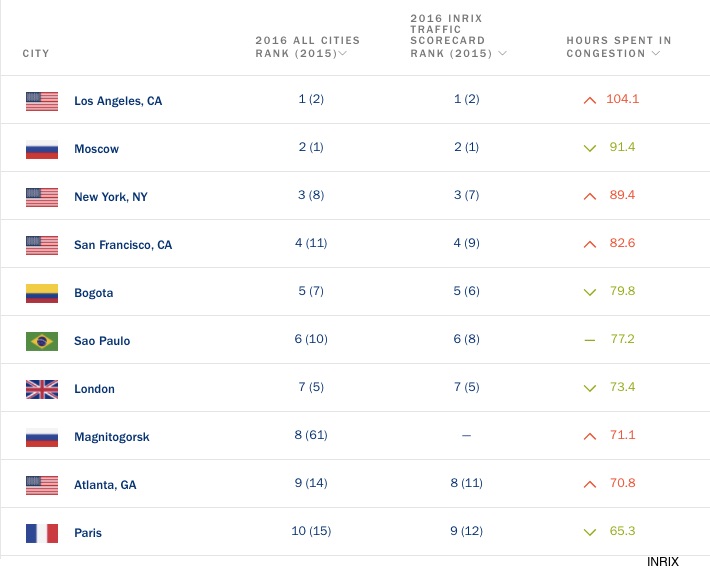
But commute time does depend on where you live. LA commuters spend the most time in traffic jams, followed by NY and San Francisco in the U.S. If you are an average Los Angeles commuter, you could sitting in traffic for 104.1 hours a year.
This table from INRIX has worldwide traffic jam ranks–and one of the few times a city does not want to be #1. The hours spent in congestion are per year:
While the American Community Survey indicates that relatively few of us bike to work, still it does depend on where you live:
We should also note that many of us walk, take public transportation, use a motorcycle, a taxi, an Uber type service, or work at home. But we will save all of that for another day.
Our Bottom Line: Negative Externalities
Defined as the impact of an activity on an uninvolved bystander, the negative externalities of commuting are gargantuan. According to The Washington Post, people with long commutes are more likely to be obese, have hypertension, be divorced and depressed. They are also less likely to vote.
Since everyone of those problems ripples beyond the individual to a family, a community and even the entire country, we have a slew of negative externalities. More simply stated though, we can say the cost–defined as sacrifice–is considerable.
My sources and more: Sometimes the American Community Survey can be rather interesting. The Washington Post used its data to summarize our commuting time. It led me to the Census Bureau where I found their biking infographic. And here, the ACS explains its commuter surveys. Finally, for endless traffic jam data about the U.S. and the world, INRIX is an interesting site.


