Four years ago, we looked at “Ice Cream Economics.” Now there is more.
6 Facts: More Ice Cream Economics
1. Favorite Flavors
One of my favorites, chocolate chip, is no longer everyone else’s choice. As a result, in supermarkets and ice cream parlors, it is tougher to locate. The NY Times tells us that grocery freezers might not stock it and ice creameries offer it less frequently.
Instead you probably prefer Dr. Pepper Float, Cherry Garcia, and Chocolate Chip Cookie Dough.
2. Tasting Ice Cream
But perhaps what matters the most is a firm’s ice cream taster. According to The Hustle newsletter, Dreyer’s (Edy’s in the Eastern U.S.) insured its chief ice cream taster’s taste buds for $1 million. The taster, John Harrison, says he tasted but “rarely swallowed” several hundred million gallons of ice cream.
For a smile, do take a look at how a taster tastes:
3. The Cone Duopoly
It’s tough to make a good cone. Consequently, we have one firm that became especially good at it. In its four North American factories, the Joy Baking Group produces between 60 and 70% of the cones that U.S. stores sell. That adds up to manufacturing as many as 20 million cones a day during the busy season. Keebler, with a 14.5% market share is in second place.
4. Most Popular Ice Cream Brands
For U.S. ice cream sales leaders, we can look to Ben & Jerry’s ($911 million), Breyer’s, and Blue Bunny. However, perhaps because we no longer buy as much in family sizes, small pints let us try smaller brands. Private labels ($1.3 billion) lead Ben & Jerry. The annual revenue for the whole U.S. ice cream market is $19.1 billion.
5. Global Consumption
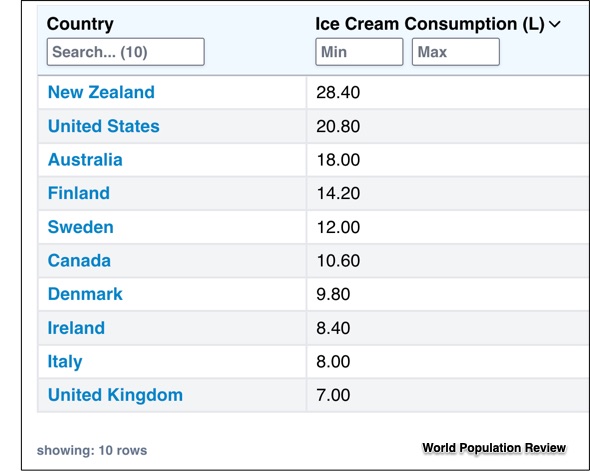
At 28.4 liters a person (60 pints), New Zealand’s annual ice cream consumption is #1 in the world. As for flavors, they like vanilla the most. Next, New Zealanders enjoy hokey pokey (vanilla ice cream with small honeycomb toffee lumps):
6. Ice Cream and IQ
Several years ago, The Economist suggested (rather frivolously) that there could be a correlation between reading ability and ice cream consumption. Ranked by PISA 2022 reading scores, below, you can see Australia’s and New Zealand’s children scored high on the reading test while both countries are big ice cream eaters. Similarly, Finland, and Canada display the same correlation. Of course, we do have exceptions like Chile where they eat a lot of ice cream but score relatively low on PISA. Further creating doubt about all of this, we can ask about Asian nations that are high on reading and low on ice cream:

Our Bottom Line: Do enjoy some ice cream!
My sources and more: Referring to the NY Times article on chocolate chip, Slate Plus Money reminded me it was time to return to “Ice Cream Economics.” I should also thank my Hustle newsletter for directing me to the cone “monopoly” (though it is a duopoly) and the ice cream taster. Then, not quite scientific but interesting, the ice cream IQ idea (with updated facts) came from The Economist while the World Population Review had the global consumption data. And finally, paywalled but still Statista let me read about the market leaders.


