The Country That Leads the EV Charge
January 18, 2023
Why a Debt Rescue Committee Is “Deja Vu All Over Again”
January 20, 2023Senior citizens have asked for a CPI-E (Consumer Price Index/elderly) that would differentiate what they buy from average consumer spending. Otherwise, based on the CPI, cost of living adjustments in their Social Security benefits might be inadequate. But seniors are not the only ones. Gen X spends differently from Gen Z. And Millennials and Boomers are different too.
Let take a look and then see why the differences matter.
Consumer Spending Differences
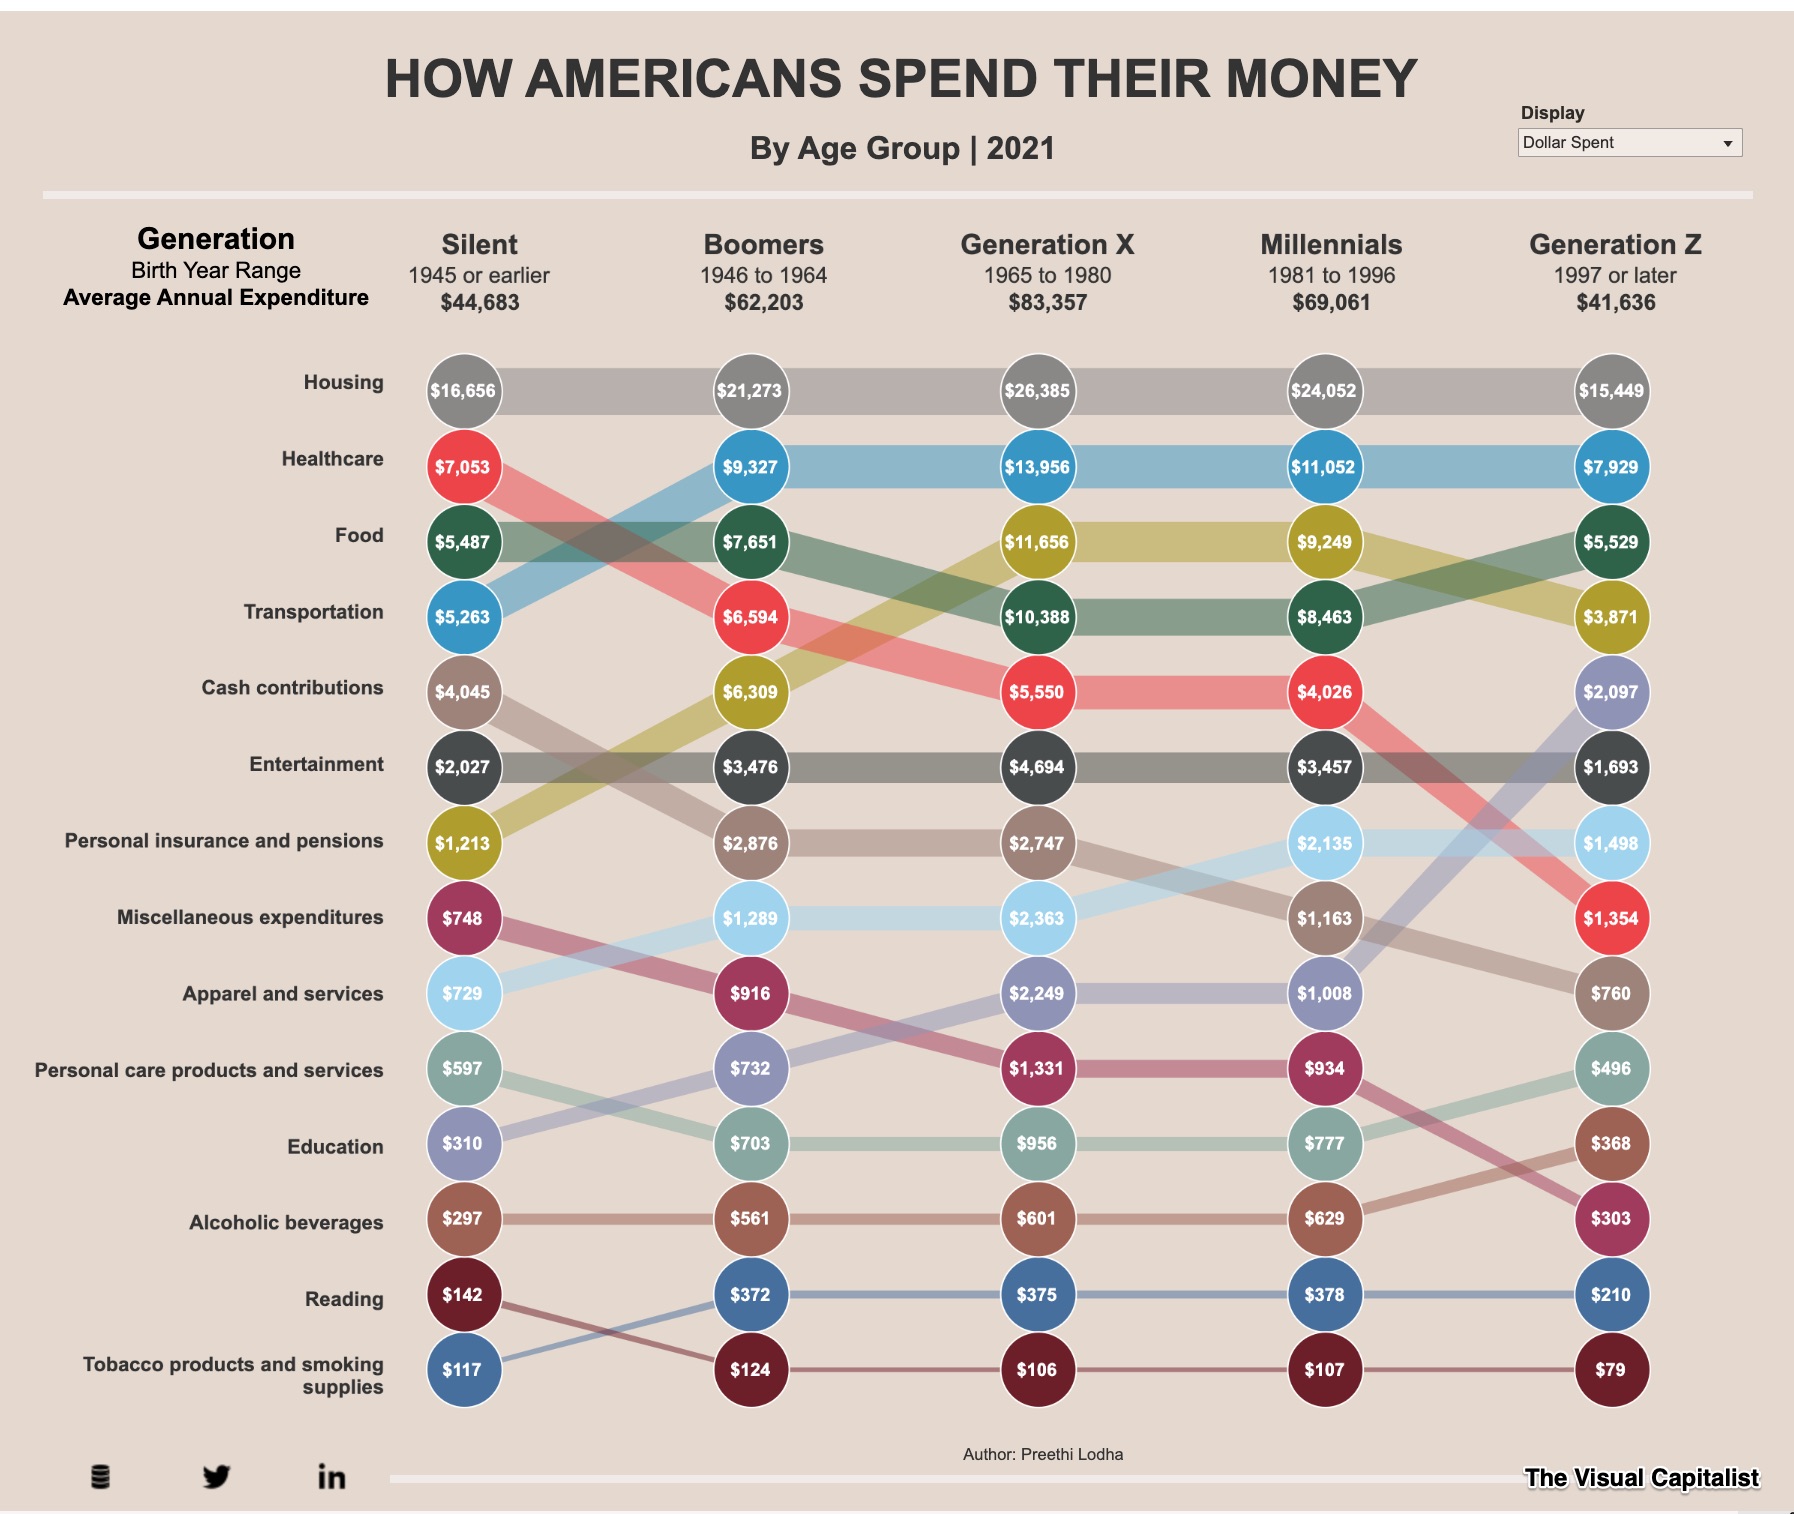
The following graphic from the Visual Capitalist color codes spending categories. So, if you want to trace transportation, just put a finger on the first blue circle and follow it across the generations. Similarly, healthcare is red.
At $83,357, Gen X (1965-1980) spends the most. Like the other age cohorts, housing costs them more. Then, for four of the cohorts, except for the Silent Generation, transportation is next. After that, we have food at #3 for the Silents, Boomers, and Gen Z. But for Millennials and Gen X, food fell to the fourth slot, behind insurance and pension spending.

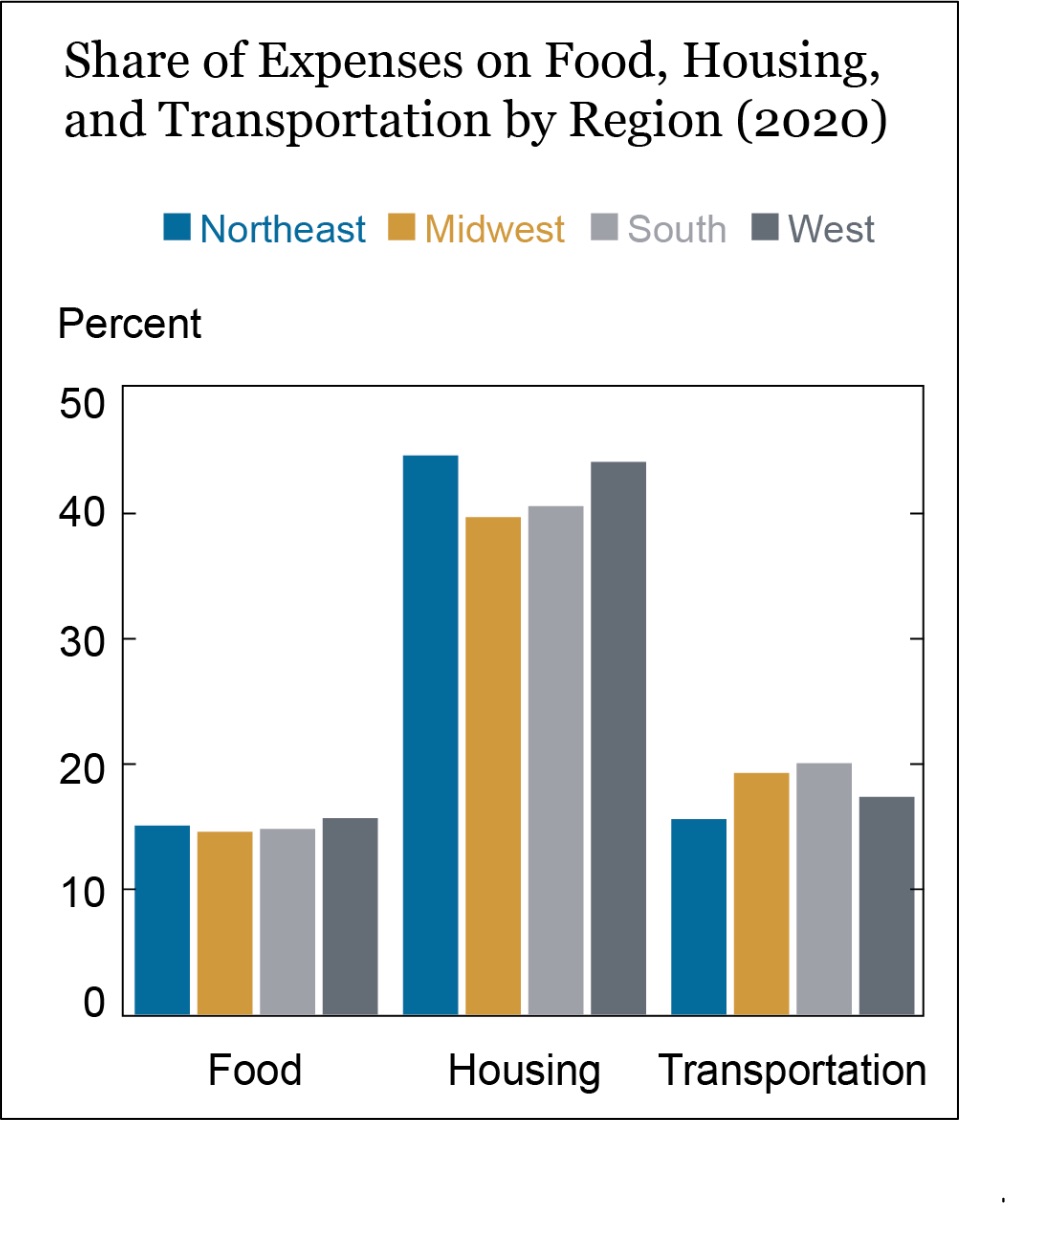
Meanwhile, our spending baskets also depend on where we live. In the South and West households spend relatively more on transportation than other regions:
 Our Bottom Line: Inflation Inequality
What we spend determines how inflation hits us. Knowing that food and transportation prices led inflation’s march upward, we can say that the generational cohorts and geographical regions that spend the most on food and transportation would have been hit the hardest by inflation. The NY Fed also concludes that higher transportation spending meant that Blacks, Hispanics, and middle income households experienced inflation the most. They point out that when inflation pushed housing and food expenses skyward, then lower income families felt it the most.
The NY Fed shows us that the Northeast has experienced relatively less inflation than other regions. Now though, the Northeast rate is rising:
So, whereas inflation is a seemingly single number, looking closer, we can see its disparate impact.
My sources and more: Randomly browsing, WEF, I discovered the Visual Capital graphic. Happily, it correlated with yesterday’s Liberty Street blog..
![econlifelogotrademarkedwebsitelogo[1]](/wp-content/uploads/2024/05/econlifelogotrademarkedwebsitelogo1.png#100878)


