At 8.7%, this year’s Social Security COLA (Cost of Living Increase) will add $145 to the $1669 an average beneficiary received last year. To find a larger increase, we have to look back to 1980’s 14.3% COLA.
Except for 2016 and 2017 when they were at zero or slightly nore, recent automatic COLAs hovered near the 2%. inflation rate that prevailed:
 Hit hard by soaring inflation and collapsing financial markets, Baby Boomers especially care about their COLAs. But, it took awhile for Congress even to realize that we needed automatic COLAs.
Social Security COLAs
Our COLA story starts in 1940 when, at 65, Ida Mae Fuller was the first U.S. retiree to get a Social Security check for $22.54. In 1941, she got $22.54 each month. In 1942, 1943, and 1944 she still got her $22.54. Until 1950, she received $22.54 a month.
Although every check said $22.54, she wasn’t really getting the same amount. In 1949, Ida Mae needed a monthly check for $38.32 to retain her purchasing power.
So, in 1950, realizing that inflation had cut what beneficiaries could buy, the Congress gave us Social Security COLAs. Since then, at first through special legislation and then automatically based on the CPI, Social Security check amounts usually rise annually.
Consumer Spending Differences
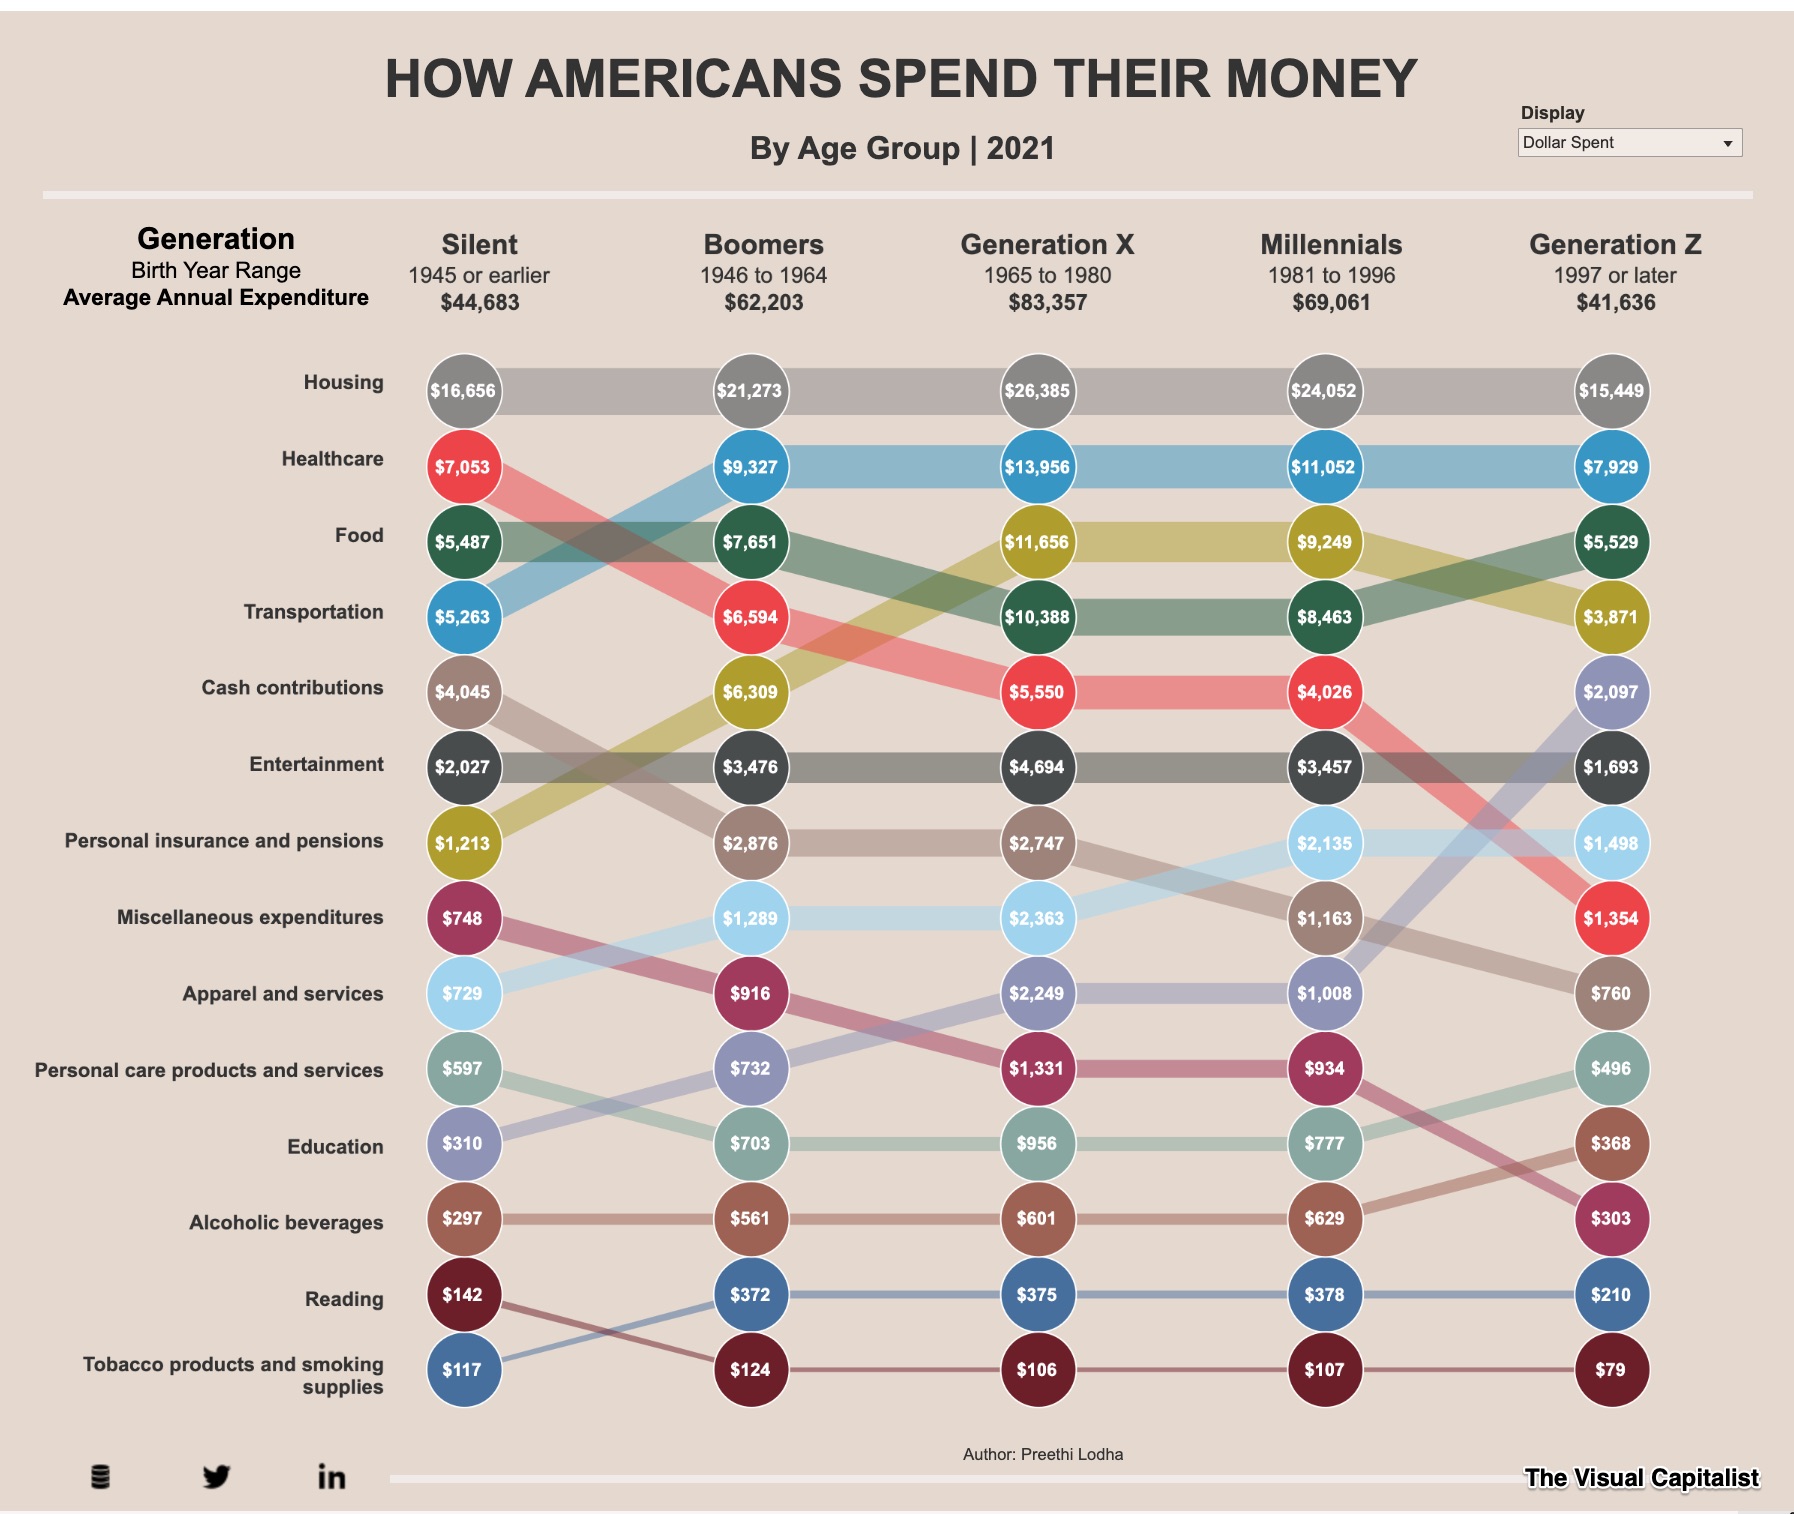
Because seniors spend somewhat differently from the rest of us and depend more on Social Security, we can ask if Social Security COLAs should be calculated differently. You can see below that housing, healthcare, food, and transportation spending for the Silent Generation and the Boomers could compose a disproportionately hefty slice of their income–especially when it is just a Social Security check.
The following graphic from the Visual Capitalist color codes spending categories. So, if you want to trace transportation, just put a finger on the first blue circle. Then, follow it across the generations. Similarly, healthcare is red:

Our Bottom Line: Inflation Inequality
What we spend determines how inflation hits us. Knowing that food and transportation prices led inflation’s march upward, we can say which generational cohorts would have been hit the hardest by inflation. In addition, the NY Fed concludes that higher transportation spending meant that Blacks, Hispanics, and middle income households experienced inflation the most. They point out that when inflation pushed housing and food expenses skyward, then lower income families felt it the most.
Finally though, we cannot ignore the ascending spending trajectory of Social Security, its dwindled trust fund, and its mismatch between workers and beneficiaries. Maybe we need to ask how we can afford what we think is right.
My sources and more: For up-to date Social Security numbers, WSJ was my destination. Fron there, you might also enjoy taking a look at the BLS experimental CPI-E for the elderly. Then, the Social Security Administration, here and here, has the ideal complement and the NY Fed looked beyond seniors.
Please note that several of today’s sentences were in a previous econlife post.


This article is excellent; one of your best for clarity and understanding the impacts of inflation and who it affects most.
Thanks!