The people who play GeoGuessr are complaining. If dropped in a random place mapped by a volunteer rather than by Google, they have to deal with a lower quality image. Since players use street sign colors and other less obvious clues to figure out their location, a blurry word (in Zanzibar) is a game changer.
And yes, as you might guess, Google has mapped many fewer streets in the less developed world. The result is an inequality that gets reinforced since Google Street View can facilitate commercial activity.
Africa’s light colored sections tell us where Google has no Street View:

However, we can also say that Google maps can locate inequality. All we need to know is the cars people drive.
Cars and Neighborhood Characteristics
Annually, we get the American Community Survey (ACS) from the Bureau of Labor Statistics. While it conveys a slew of statistics, the problem is a time lag that could exceed two years. Because our government tends to use people rather than technology for gathering data, what we learn can be out-of-date. Instead, scholars from four U.S. universities demonstrated how Street View from Google Maps could provide data much more quickly.
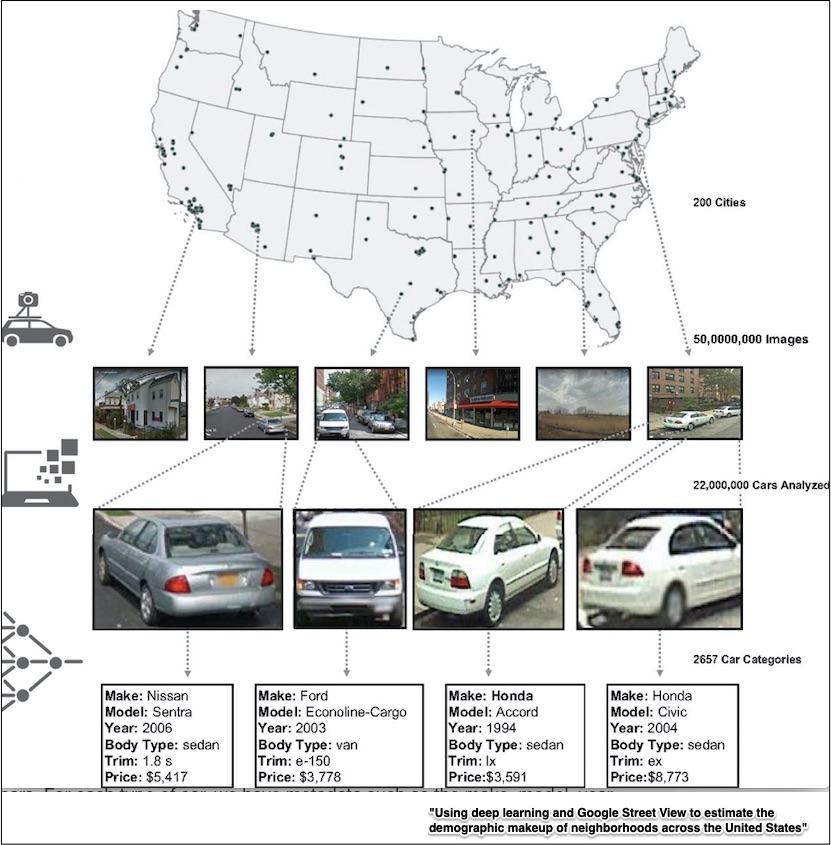
Using 22 million Google Street View images of cars that were placed into 2,257 categories, they hypothesized neighborhood characteristics for race, income, political preference, and education. The entire process was expedited through a program called Convolution Neural Networks (CNN) that could identify vehicle make, model, year, and classify 50 million images from 3,068 zip codes–39,282 voting precincts and 200 cities–in just two weeks. To confirm their accuracy, researchers then compared their conclusions with the ACS and election data.
Below are some of the study’s images and the cities they came from:

In the following maps of the U.S., you can see the correlation between car and political preferences. Sedans predominated in precincts that voted for Obama while extended pickup trucks identified Republican concentrations:

Researchers also observed that people of Asian descent tended to drive Hondas and Toyotas whereas in Caucasian neighborhoods, they identified pickup trucks, Volkswagens, and Aston Matins. Meanwhile, if they noted a predominance of cars made by Chrysler, Buick, and Oldsmobile, then the area was more likely to be African American.
Below, I’ve copied their list of the top five and bottom five attributes of cars that correlated with different educational levels. People with the least years of education were connected to the oldest cars and individuals with graduate degrees probably won’t own a Chevrolet or a Dodge:
Our Bottom Line: Statistical Timeliness
We’ve noted that the difference between the ACS and using Google Street View is timeliness. Somewhat similarly, CPI data collectors personally go to stores to determine price trends that are reported monthly. However, the billion price project has contemporaneous online prices. They say their goal is to improve macroeconomic data.
So, today’s post leaves me with a question. I wonder where our government uses the timely data they need for optimal policy making.
My sources and more: You might want to start where I began with Rest of World and Google Maps. From there, my perspective flipped. Instead of Google creating inequality, this BBC article discussed how it recorded it. Then, this paper had the detail. And finally, there is a GeoGuessr free version.


