The U.S. birth rate has been gliding downward. Per thousand women, aged 15 to 44, the general fertility rate dipped from 60.1 in 2018 to a provisional 56.8 during the end of 2020:

Correspondingly, remaining at 20 percent, there is no uptick in the share of women with 3-child families:

At 3,745,540 in 2019 (provisionally), it all adds up to the fewest births since 1985. The result is a plunge below the replacement rate of 2,100 births that 1,000 women would need to produce in a lifetime to replace their generation. In 2019 we were at 1,705 per 1000 women.
Asking why, researchers have suggested time, or career, or expense, or changing norms that no longer mandate motherhood. There also have been fewer teenage pregnancies.
Then, rather unexpectedly, a new study blames car size.
Family Size and Cars
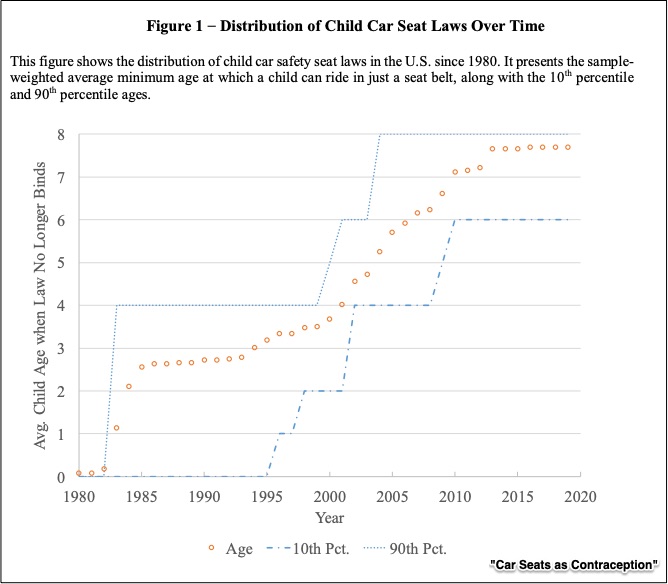
In a paper wonderfully called “Car Seats As Contraception,” researchers link the decision to have a third child to state safety regulations. When increasingly older children have to sit in a baby seat, two parent families need to fit the kids in the back seat. Most cars accommodate two children. However, you need a pricier SUV or a minivan for three children. The result, they hypothesize, is 8,000 fewer births during 2017.
You can see that children’s ages crept higher in car seat regulations:

The study’s authors tell us that all of the usual reasons do not sufficiently explain dropping birth rates. Increased female labor force participation, more access to contraception, increased female education and a higher return to human capital did not correlate. Also, before the coronavirus contraction, we had a recovery during which families had more money for available children.
Instead, they wound up with child car seat laws. Looking at safety seat regulation from 1973 to 2017, rather astoundingly, they found a connection. They also observed that higher income families seemed more likely not to have that third child than those that earned less. Furthermore, they conclude that lawmakers overestimated the number of deaths they prevented and ignored the reduction in the birth rate. As a result, the cost of the unintended consequences was excessive.
Our Bottom Line: Demographics
Citing the declining birth rate, the CBO (Congressional Budget Office) projects that the ratio of working age adults to senior citizens will fall from about 4 to 1 in 2016 to 2.6 to 1 in 2050. At the same time, the number of people age 65 or older will soar:

In previous posts, we’ve used an old-age dependency ratio, (number of people 65 and over as a percent of the labor force) to convey the impact of a growing elderly population. Now we can look at both the numerator and the denominator of the dependency ratio. Not only do we have more older people but also the younger population is not even replacing itself.
Can we just say we need bigger cars?
My sources and more: In a NY Times Upshot, Clare Cain Miller alerted me to the car seats paper. From there, the CDC was the perfect place to access a slew of statistics, here and here. Then, to complete the picture, the CBO had the demography.


