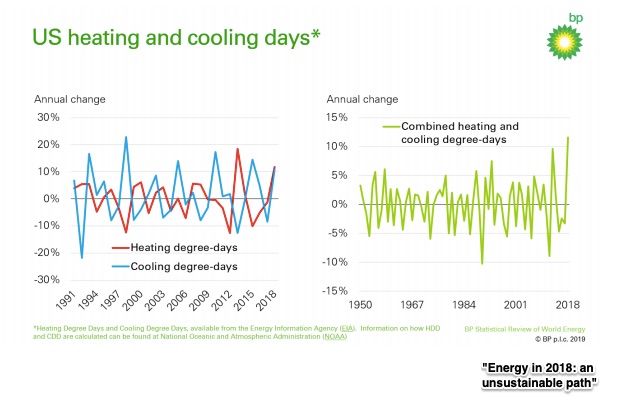
Throughout 2018 in the U.S., it was unusually hot and unusually cold. The strange part though was having both. Typically, we have many more cold days or more that are hot. Then, the absence of one offsets the other’s energy use.
Not last year.
Add to that an uptick in China’s iron and steel production and Asia’s growing demand for power and you wind up with more global energy consumption.
Six Facts: Global Energy Consumption
1. How much has global energy consumption grown?
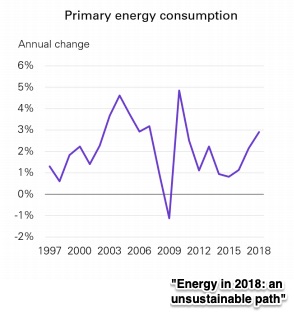
At 2.9% in 2018, energy consumption was up the most since 2010:
2. Which countries dominate global energy consumption?
The U.S., China, and India were the source of two-thirds of the world’s increase in energy consumption:
 3. Oil Production
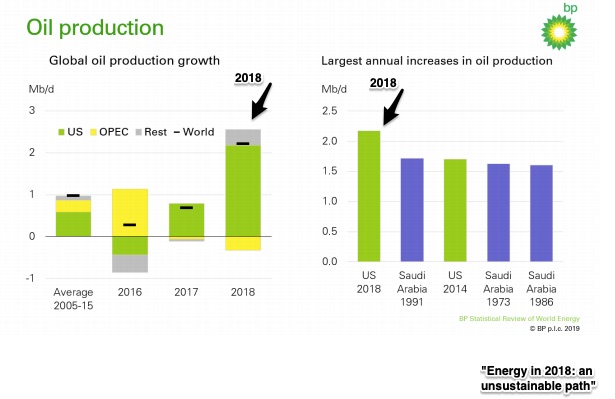
Oil production was up:
 4. Natural Gas Consumption
At 45%, the growth rate for natural gas consumption was particularly high:
5. Coal Consumption and Production
Primarily in Asia. coal demand and production were up. Statisticians thought that 2013 was the peak for coal use but now they are not so sure:
 6. Renewables Consumption
Although renewables use is up, they still represent approximately 5% of energy consumption: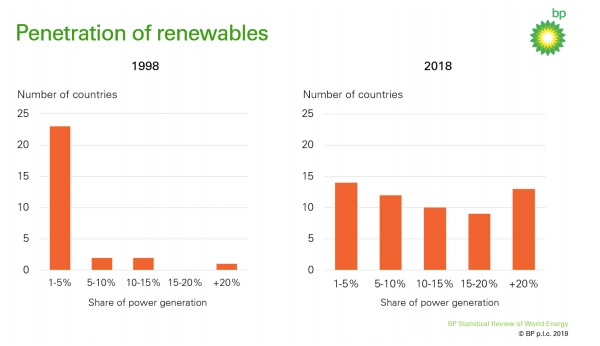
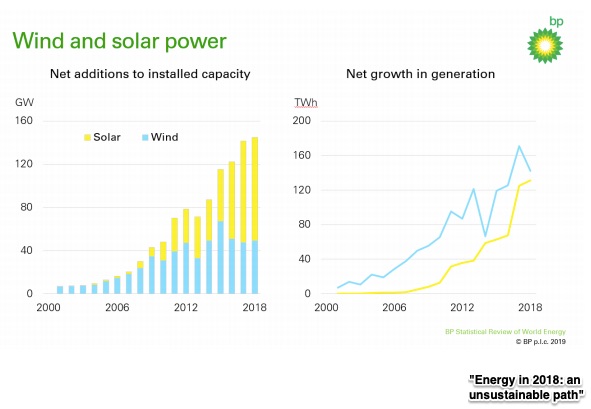
While you can see continued growth in wind and solar power generation, recent rate increases were flat:
So where are we? The sources of energy consumption are shifting. As a share of the total, oil is down, natural gas and renewables are up, and coal has remained the same.
But we cannot end here.
Our Bottom Line: Per Capita GDP
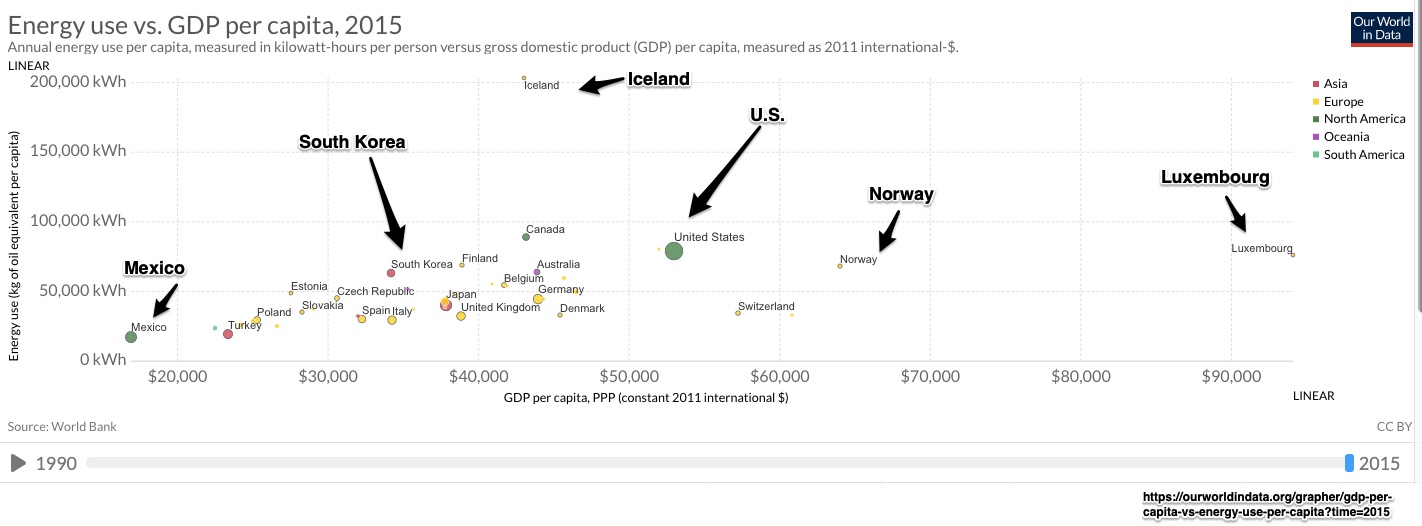
In many ways, our energy use relates to the value of the goods and services we produce. Below, we can see that developed nations with a higher GDP per person tend to use more energy. But the numbers do vary.
These are the stats. My larger print selection was random:
My sources and more: Thanks to the Conversable Economist for alerting me to the new BP report on energy. Meanwhile, NPR and the Washington Post had some weather facts.


