![econlifelogotrademarkedwebsitelogo[1]](/wp-content/uploads/2024/05/econlifelogotrademarkedwebsitelogo1.png#100878)


Using Pizza to Understand the Trade Deficit
March 12, 2018
McDonald’s Soggy French Fries Problem
March 14, 2018
OPEC is trying to decide how to fight the U.S. frackers.
OPEC’s Dilemma
Last November, OPEC (the Organization of Petroleum Exporting Countries) and a group of Russian-led nations agreed to continue their 2% oil supply cut. The problem though is the target price. Saudi Arabia has said it would be happy with $70 a barrel while Iran prefers $60. Their disagreement relates to the U.S. shale oil producers.
Supplying approximately 60% of the world’s oil, OPEC and the Russian group have the other 40% to worry about. Their main concern is how their price will impact U.S. shale production. Iran believes that a higher price will encourage too much new oil from the U.S. Disagreeing with the Saudis, they say price would decrease substantially.
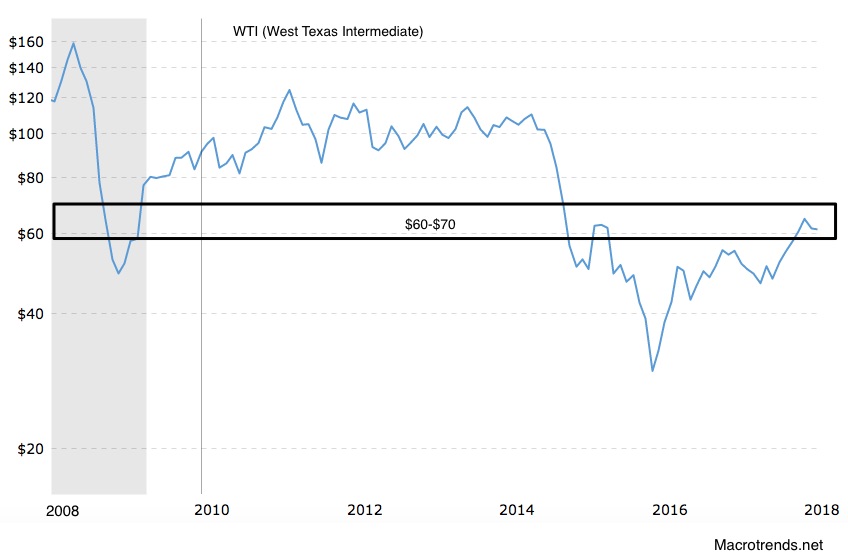
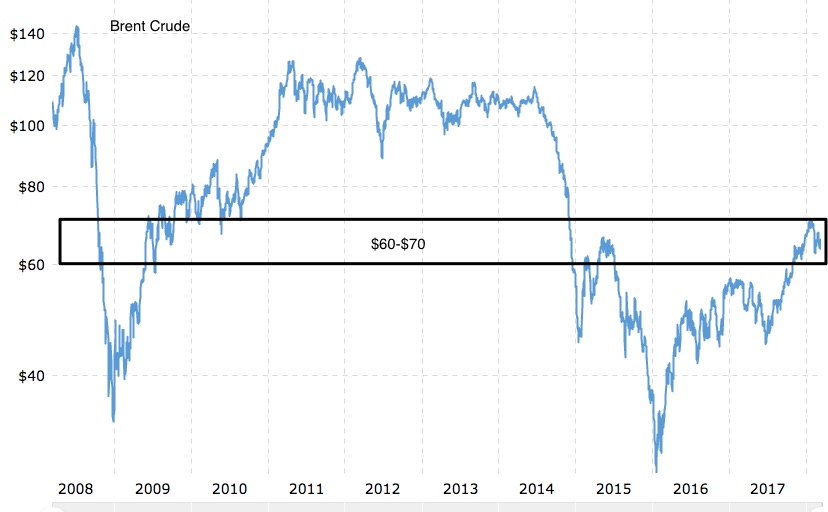
Oil Price History
You can see below that OPEC has been on a price roller coaster that shale oil helped to fuel:
WTI:
Brent:
Breakeven Prices
Perhaps though, everyone’s biggest concern is breakeven.
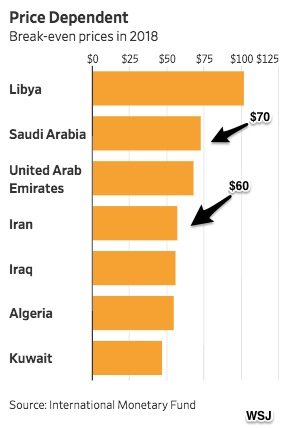
OPEC
The following graph shows the breakeven oil price for seven of OPEC’s 14 member nations. However, instead of production costs, breakeven refers to balancing the budget:
Shale Oil
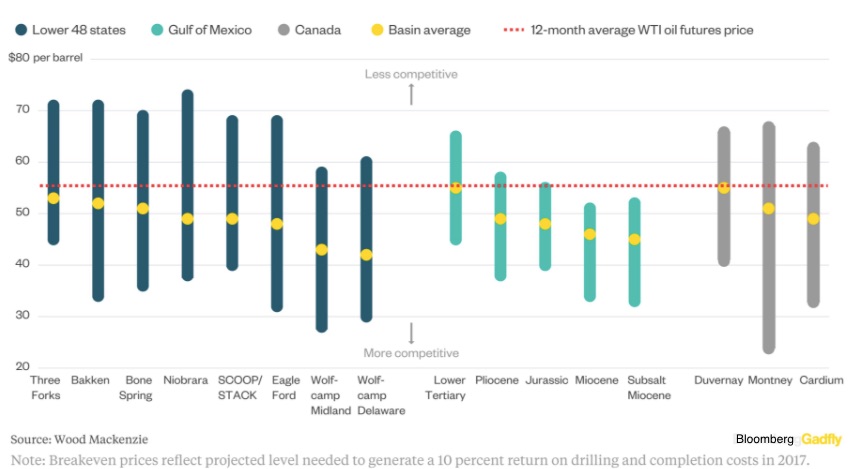
Meanwhile, based on production costs, a shale breakeven demonstrates why the Saudis and Iran are debating the $60-$70 range. For example, assuming that production is $52, administrative costs, $4, and transportation by rail, $12 (a pipeline is cheaper), the 2017 projected Bakken breakeven price was $68 a barrel.
Shale breakeven prices:
Our Bottom Line: Supply
Returning to the Saudis and Iran, we just need to shift our supply curve to see why they are so worried. Prices could fall far below their breakeven.

My sources and more: Thanks to WSJ for reminding me it was time to return to oil. From there, you might want to look at the output side of the OPEC debate here and then these contrasting discussions of what Saudi and shale breakeven mean. On the other hand, just for the timeless overview, I suggest this New Yorker article from 2014. Also, my WTI and Brent graphs were from Macrotrends.net.


