Sometimes a picture can say more about China’s economic growth than one thousand statistics:
In this dazzling NASA satellite image (2016) of the earth at night, China is somewhat lit. Assuming that more light means more activity, we can form hypotheses about economic growth.
Where are we going? To validating China’s economic statistics.
China’s Economic Growth
China’s GDP growth has generated some skepticism. Western analysts wondered if growth could have continued after the 2015 stock market crash. Even Premier Li Keqiang has said that the GDP was “manmade.”
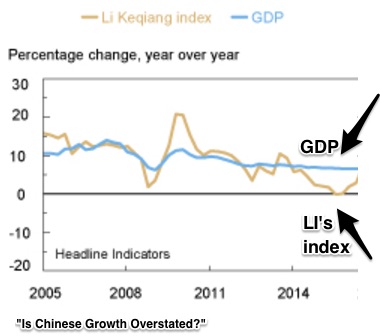
The result has been alternative yardsticks. When he was a provincial official, the Chinese Premier proposed a new metric. He thought that the growth rates of electricity consumption, rail cargo volume and bank lending should be averaged.
You can see below that his metric indicates the GDP can be over- or understated.
Meanwhile, China journalist Tom Orlik presented six different ways to gauge the Chinese growth rate. Citing Barclay’s and Bloomberg, he explained why China’s official figures could be high.
Below, the official Chinese 2015 growth rate is 6.9% while Barclays estimates 5.5%:
Bloomberg also concludes that China’s figures are inflated:
Our Bottom Line: GDP Accuracy
It is tough to calculate an accurate GDP in a developing nation. Just collecting the data can be daunting. And then, local officials might have the incentive to fake figures and small businesses tend to keep sparse data.
Consequently, satellite related facts can come in handy. Unrelated to local officials, small businesses, and political bias, satellite images complement official reports. Used with the Li Keqiang index, they showed that banks loans needed to be overweighted.
Most surprisingly though, the satellite reports indicated that Chinese economic growth was sometimes understated:
My sources and more: Always a source of interesting topics, the New York Fed’s Liberty Street blog explained the economic significance of satellite images. The Fed discussion led me to a more detailed NBER paper. Then, offering a counterpoint, this Bloomberg article from Tom Orlik presents alternative growth estimates. Finally, I do recommend going to the NASA website to see the best nighttime images.


