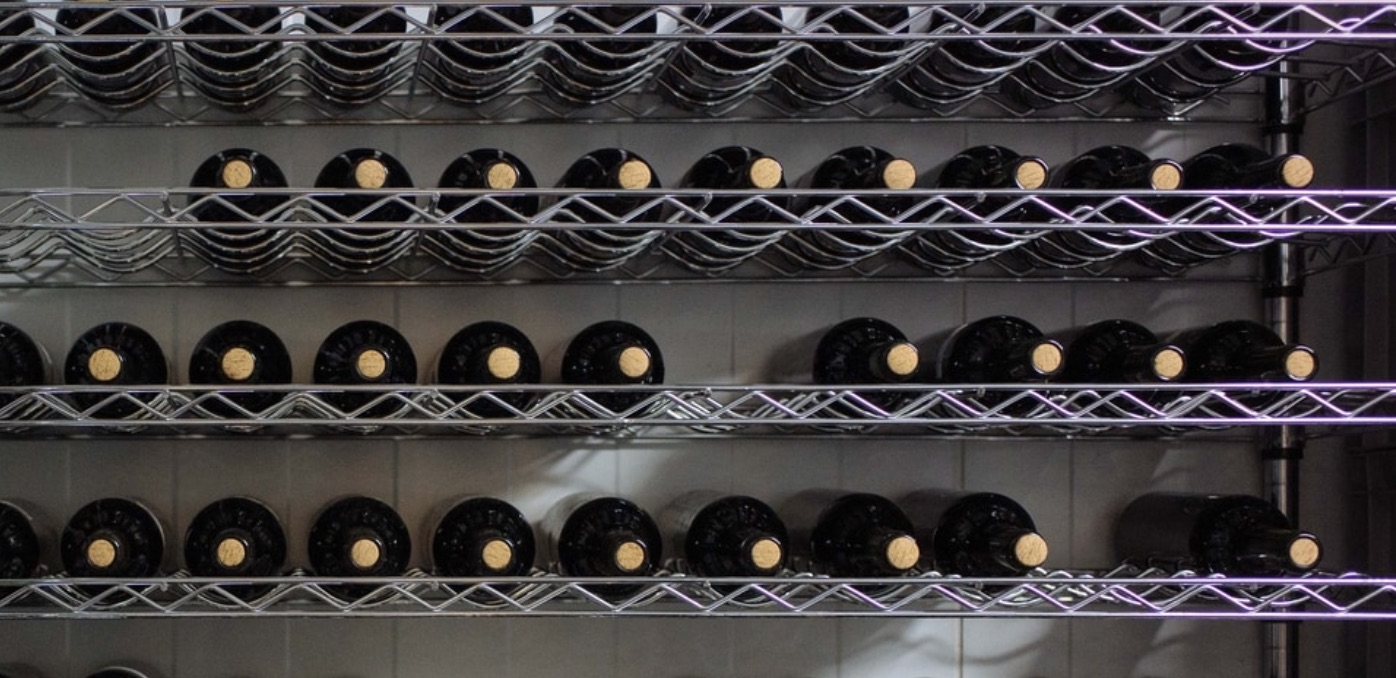
We can add cork stoppers and bottle screw tops to the world’s changes in supply.
As a result, we might be opening our wine bottles differently.
Wine Corks and Screw Tops
Wine Corks
To make cork stoppers, you just need to cut the cork from the tree, lay the planks on trucks, and transport them to the processors. From there (and elsewhere) the world’s largest cork producer supplies us with more than 5 1/2 billion cork stoppers a year. Correspondingly, two thirds of the 20 billion bottles of wine produced each year use corks.
However, during the 1990s, “cork taint” was a big worry. More simply known as “being corked,” the taste of some of our wine was spoiled by the TSA in the cork stoppers. Responding, bottlers increasingly used metal screw tops and creative packaging like boxes and cans. Now though, we have a cork comeback because scientists figured out how to remove the TSA.
As a major cork producer, Portugal is enjoying the increase in demand. In addition, we can all be happy because cork is unusually “green.” When the cork oak ages, its carbon storage capacity grows.
Portugal’s Allentejo region is the world’s largest cork producer:

Screw Tops
Meanwhile, screw tops for wine bottles have become more popular. Especially appropriate for young white wine, they also can be used for higher quality bottles.
This is where Ukraine enters the picture. As a major maker of screw tops, Ukraine’s production has been limited by the war. One of its largest screw cap producers reports huge supply side cutbacks. Then, also exacerbating the reductions, demand from Ukraine, (of course) Russia, and Europe are down.
Our Bottom Line: Demand Determinants
As economists, we can illustrate the changes in supply and demand.
Below you can see the decrease in demand for cork stoppers because of worries about “being corked.” But then, we have the supply curve shifting with the elimination of almost all TSA:

However, with metal screw caps, we have precisely the opposite. After demand surges, the quantity supplied increases. But then, with the war, supply decreases:
 So, where are we? We can conclude by saying that economics is everywhere, even in our wine.
My sources and more: Called “The Return of the Wine Cork,” again, a Business Daily topic grabbed my attention. And from there, we found this article with the Ukraine screw cap connection.
Please note that an incorrect supply graph was corrected after publication to accurately illustrate a decrease in cupply.


is the second graph correct? Supply decreasing should be a leftward shift in the supply curve,, shouldn’t it?
perhaps I am getting the markets mixed up. ….
Will-
Thank you! Yes, the arrow needed to be reversed.
Second graph in second panel incorrect. Yes, decrease = left shift. “But then, with the war, supply decreases…”
John-
Thanks so much! The graph is wrong. I corrected it to show the decrease in supply.