Global alcohol consumption varies.
It all depends on where you live.
Six Facts: Global Alcohol Economics
1, Global averages
At 6.18 liters, the global average for alcohbol consumption can best be understood through bottles of wine. If we assume that a bottle of wine has 12 percent alcohol per unit of volume then one liter of wine has .12 liters of alcohol. To get the 6.18 total, we need to drink almost 53 bottles of wine
2. Regional Differences
To see minimal alcohol dinkers, we can travel to the Middle East and North Africa. Then, at the other extreme, across the Mediterranean, Europeans average as much as the equivalent of two bottles of wine a week–approximatey 11-14 liters annually.
You can see that the dark blue indicating higher averages is concentrated around Europe:
3. What We Drink
Alcohol preferences vary. As you might expect, wine is popular in France. For Japan, we see the spirits secrtion dominate while for Australia, it’s beer:
France Japan Australia

4. Drinking History
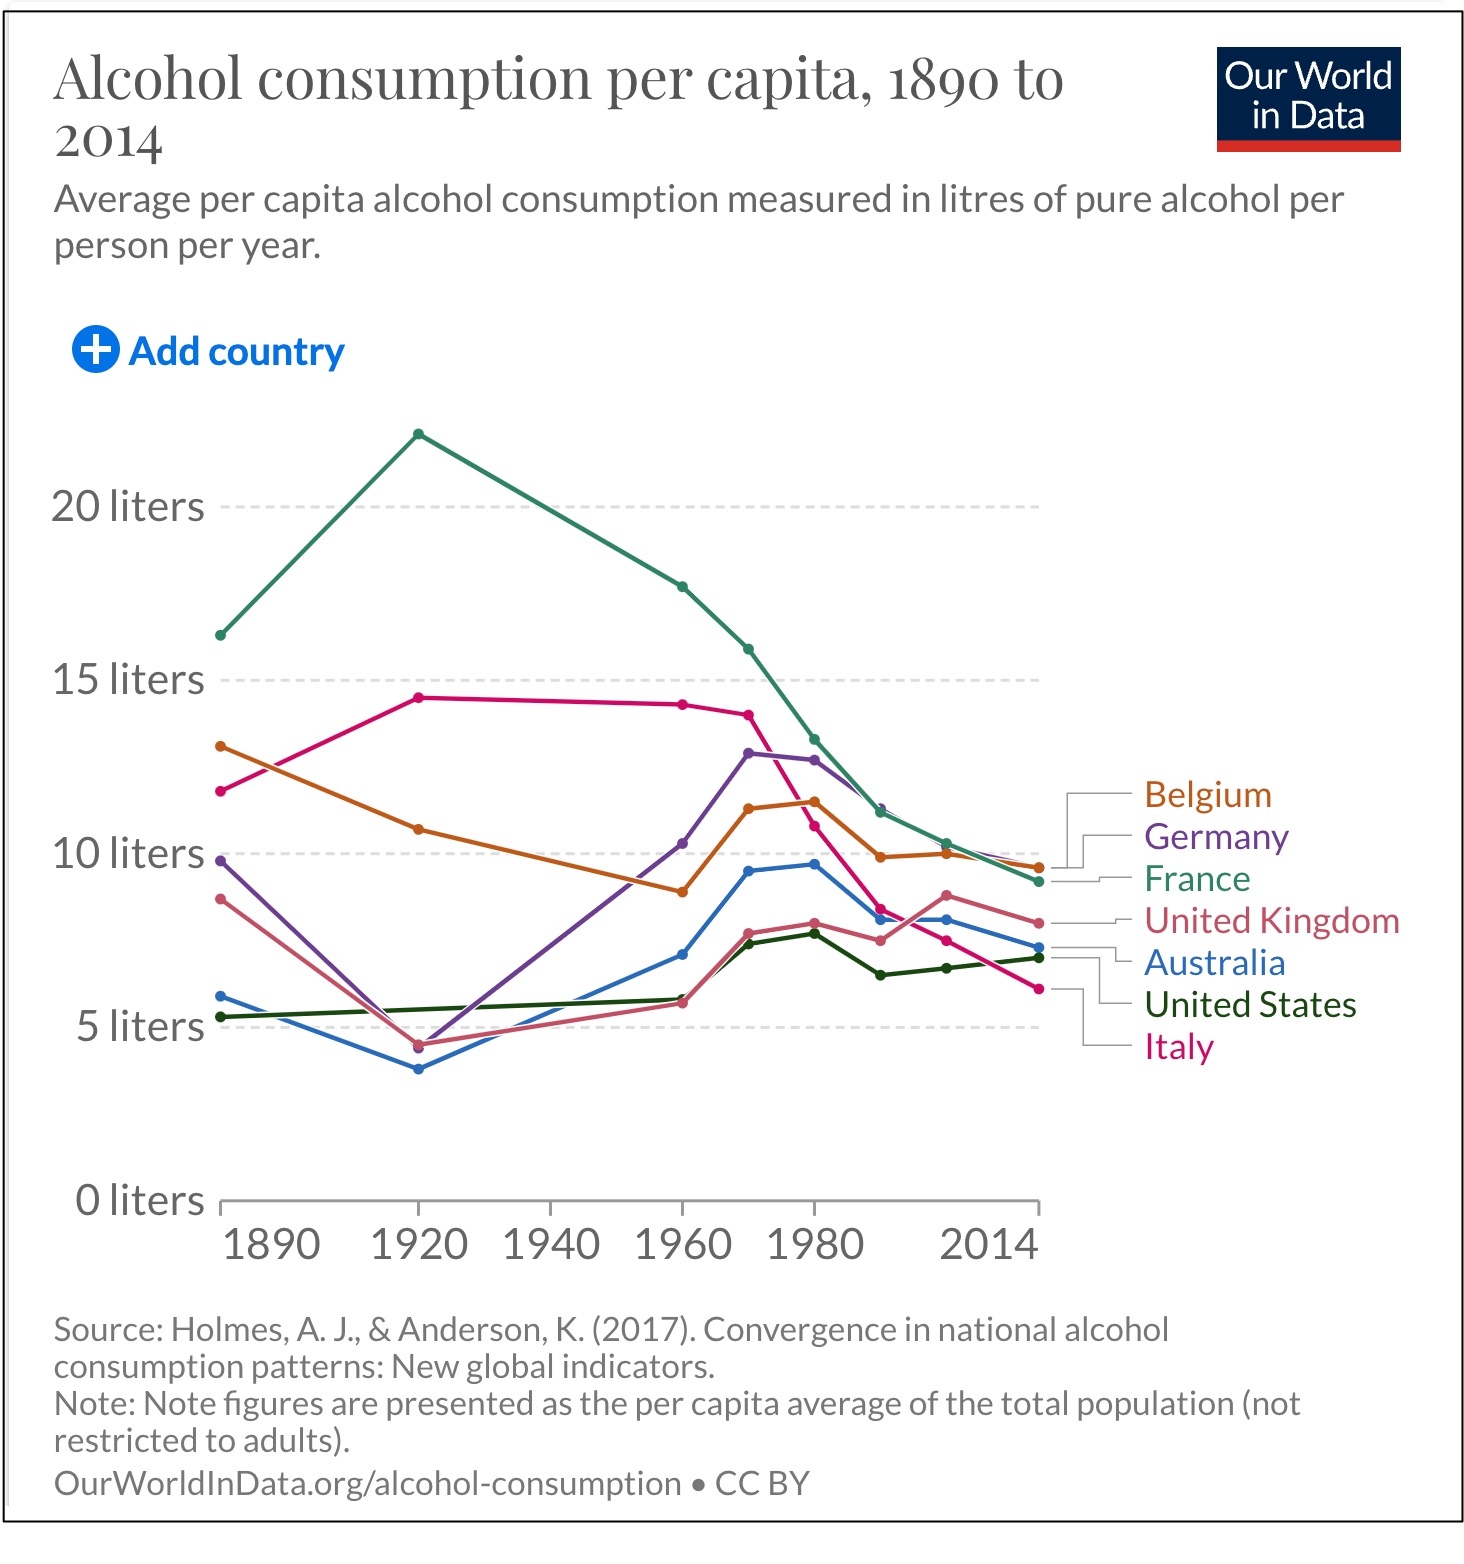
Looking back, we would see we used to drink more, especially in Framce. Because of prohibition, the U.S. dipped considerably during the 1920s:

5. The Beer Sector
Including retailers and brewers, beer distributers and hospitality firms, the beer sector of the global economy supported 23 million jobs in 2019:

6. Lower Income Countries
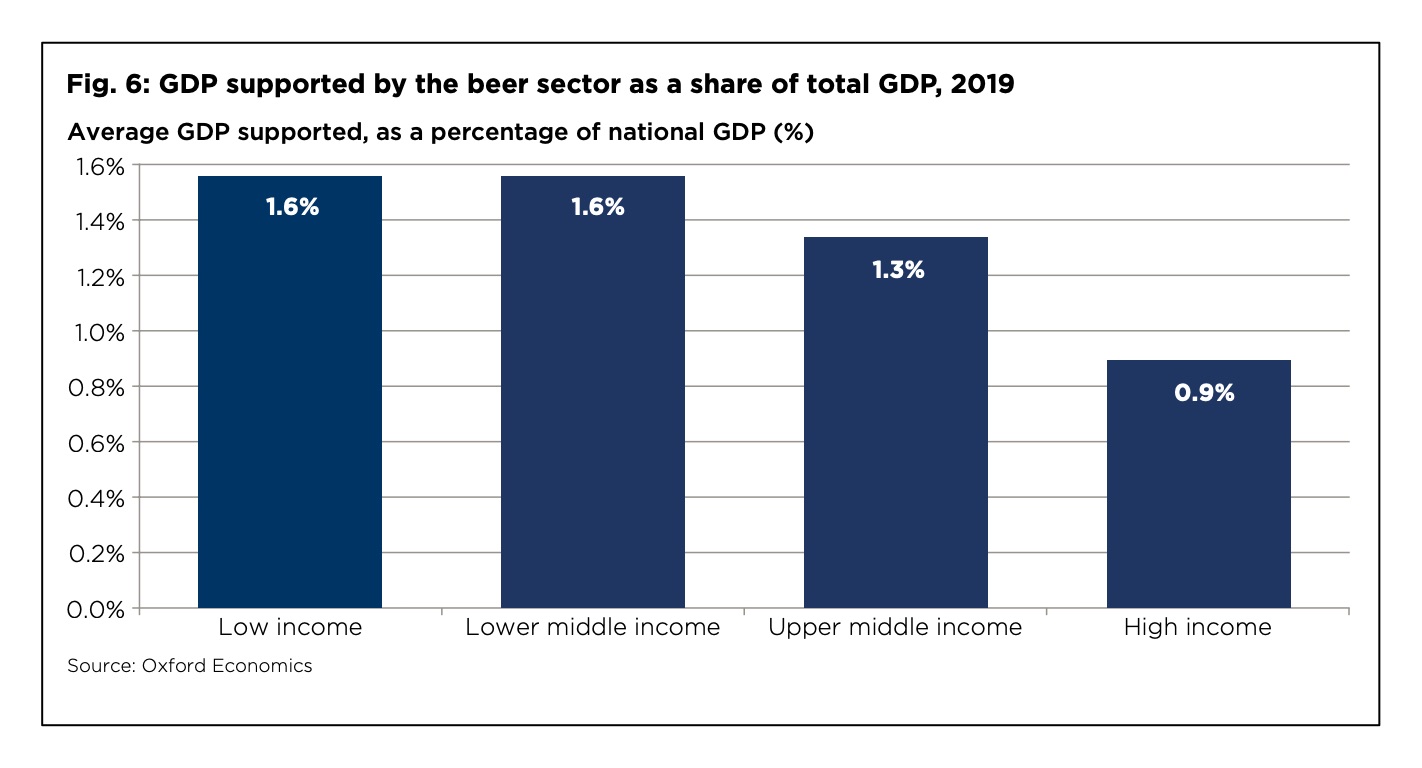
An Oxford Economics report tells us that the beer sector especially boosts the GDP of lower income countries. Their examples included Cambodia, Lesotho, and Bolivia:
 Our Bottom Line: Externalities
Defined as the impact on a bystander, an externality can be negative or positive. The negative side takes us to health and the impact of excessive drinking. However, on the positive side, we have industries that provode jobs, goods, and services. According to an Oxford Economics report, the beer sector added $555 billion to the global 2019 GDP.
Less than one percent of global GDP spending, still, the numbers are large:
 My sources and more: Our World in Data is always my go-to website for statistical analysis. A good complement, this beer industry report completed the picture. But, we should remember that the beer industry paid for the Oxford Economics report. And finally, after rereading one of my past alcohol posts, I suggest you take a look. It is one of my best.


 Our Bottom Line: Externalities


