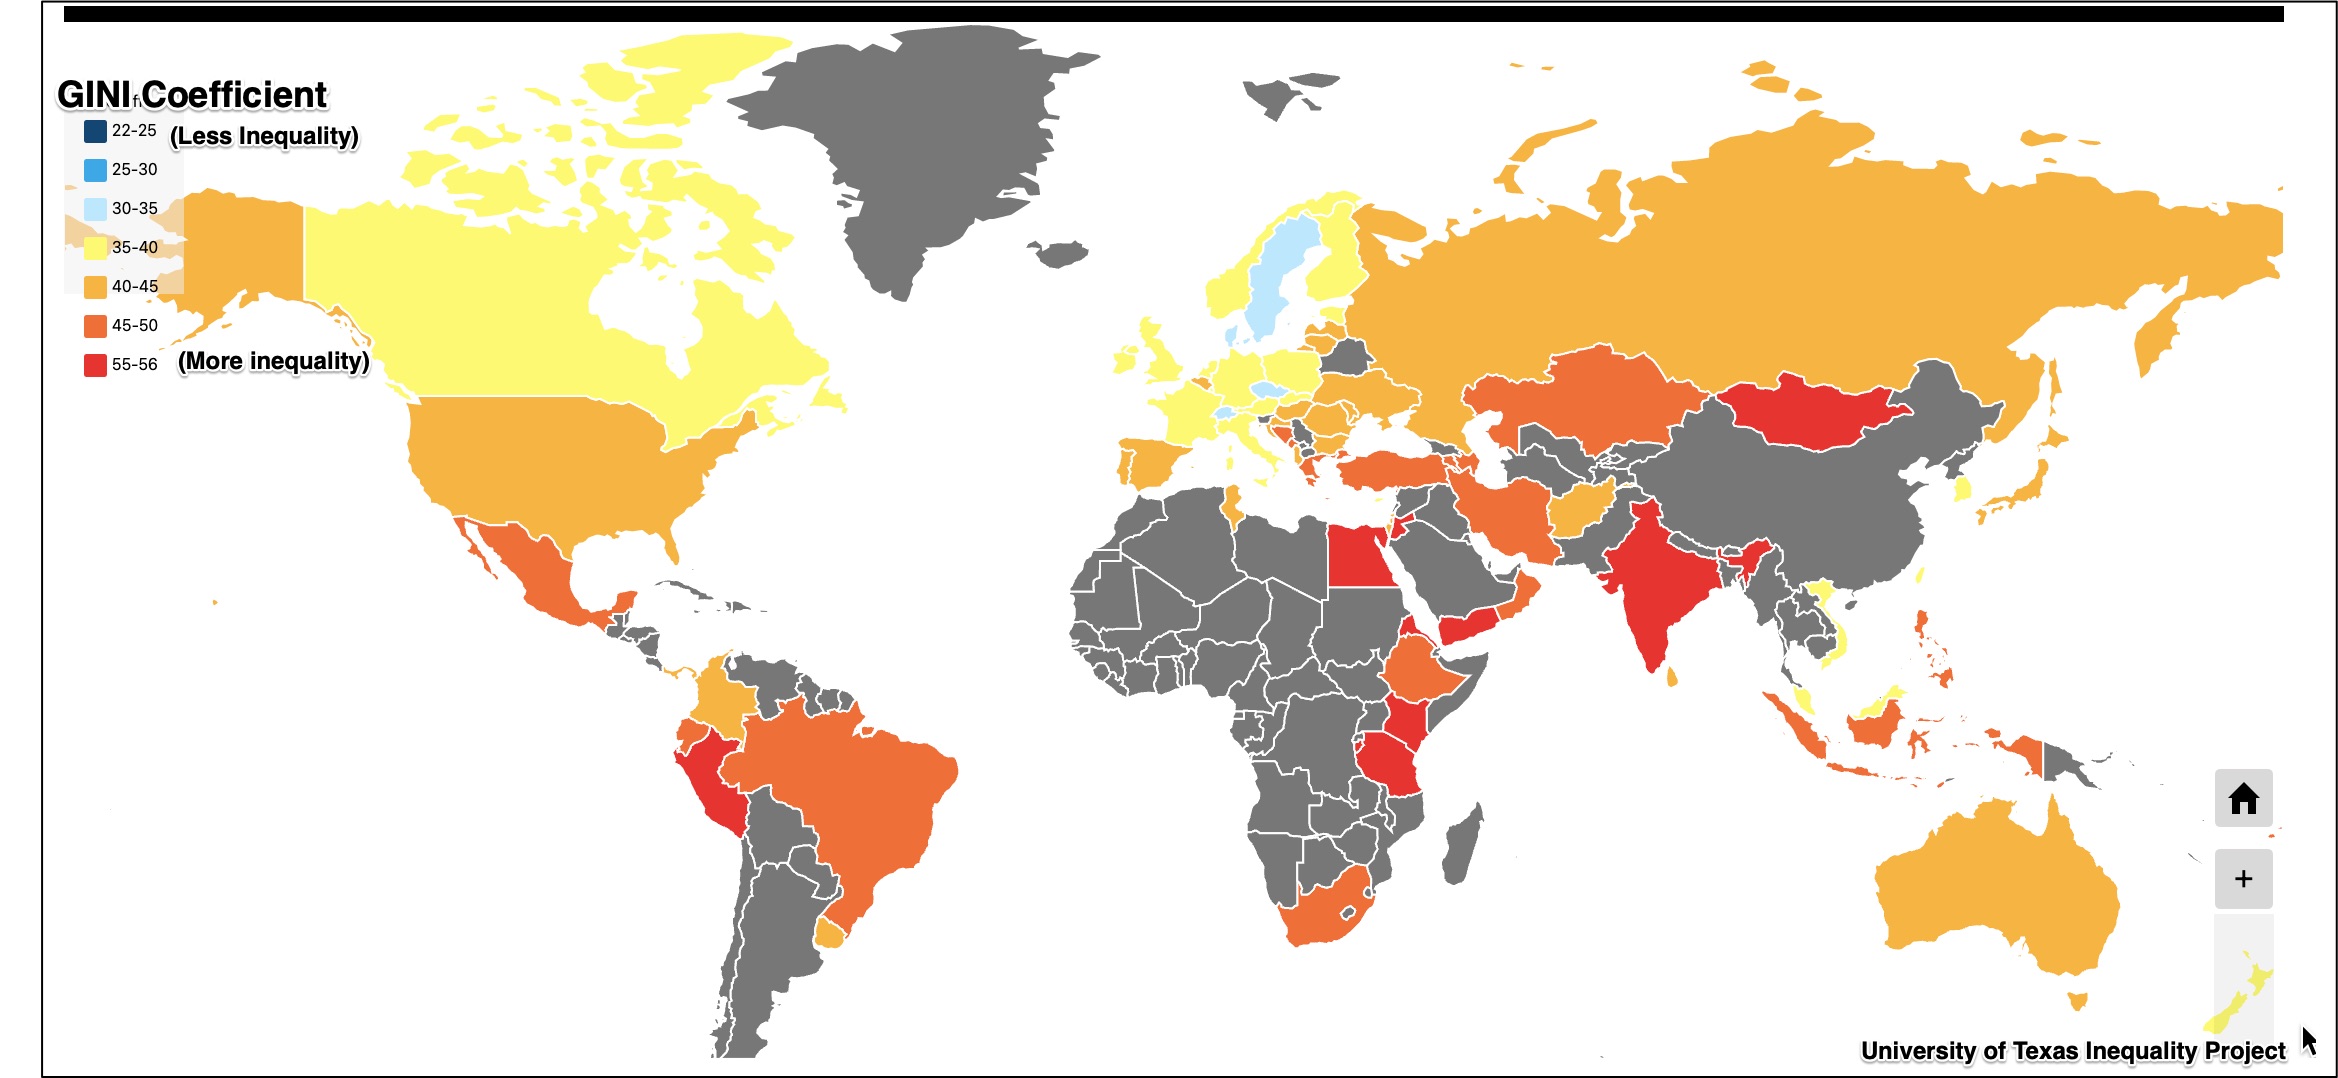
Economist Branko Milanovic has a new paper that details global equality since 1820.
Let’s take a look.
Global Inequality
1. We can start with a definition.
Dr. Milanovic tells us that global inequality is “inequality in real incomes between citizens of the world.” Then, comparing these citizens, he looks between countries and within them.
2. Tracing global inequality, we would see three eras.
The three eras are 1820-1950, 1950-2000, and 2000-2018. Having insufficient data beyond 2018, he stopped four years ago:
3. The initial era of inequality was characteerized by divergemce.
We start the 1820 to 1950 split with the Industrial Revolution. Called the Great Divergence, during the 19th century, North-Western Europe, North America, and Japan industrialized while China, India, and Africa slipped behind with stagnant or declining economies.
4. There were “three worlds” during the second half of the 20th century.
We have the advanced capitalist countries characterizing the “first world” while the USSR and Eastern European socialist countries compose the “second world.”. As for the “third world,” we travel to Asia, Africa, and countries that had been colonized. Still picturing a world with three parts, we could add Latin American nations to the third group although they were somewhat richer.
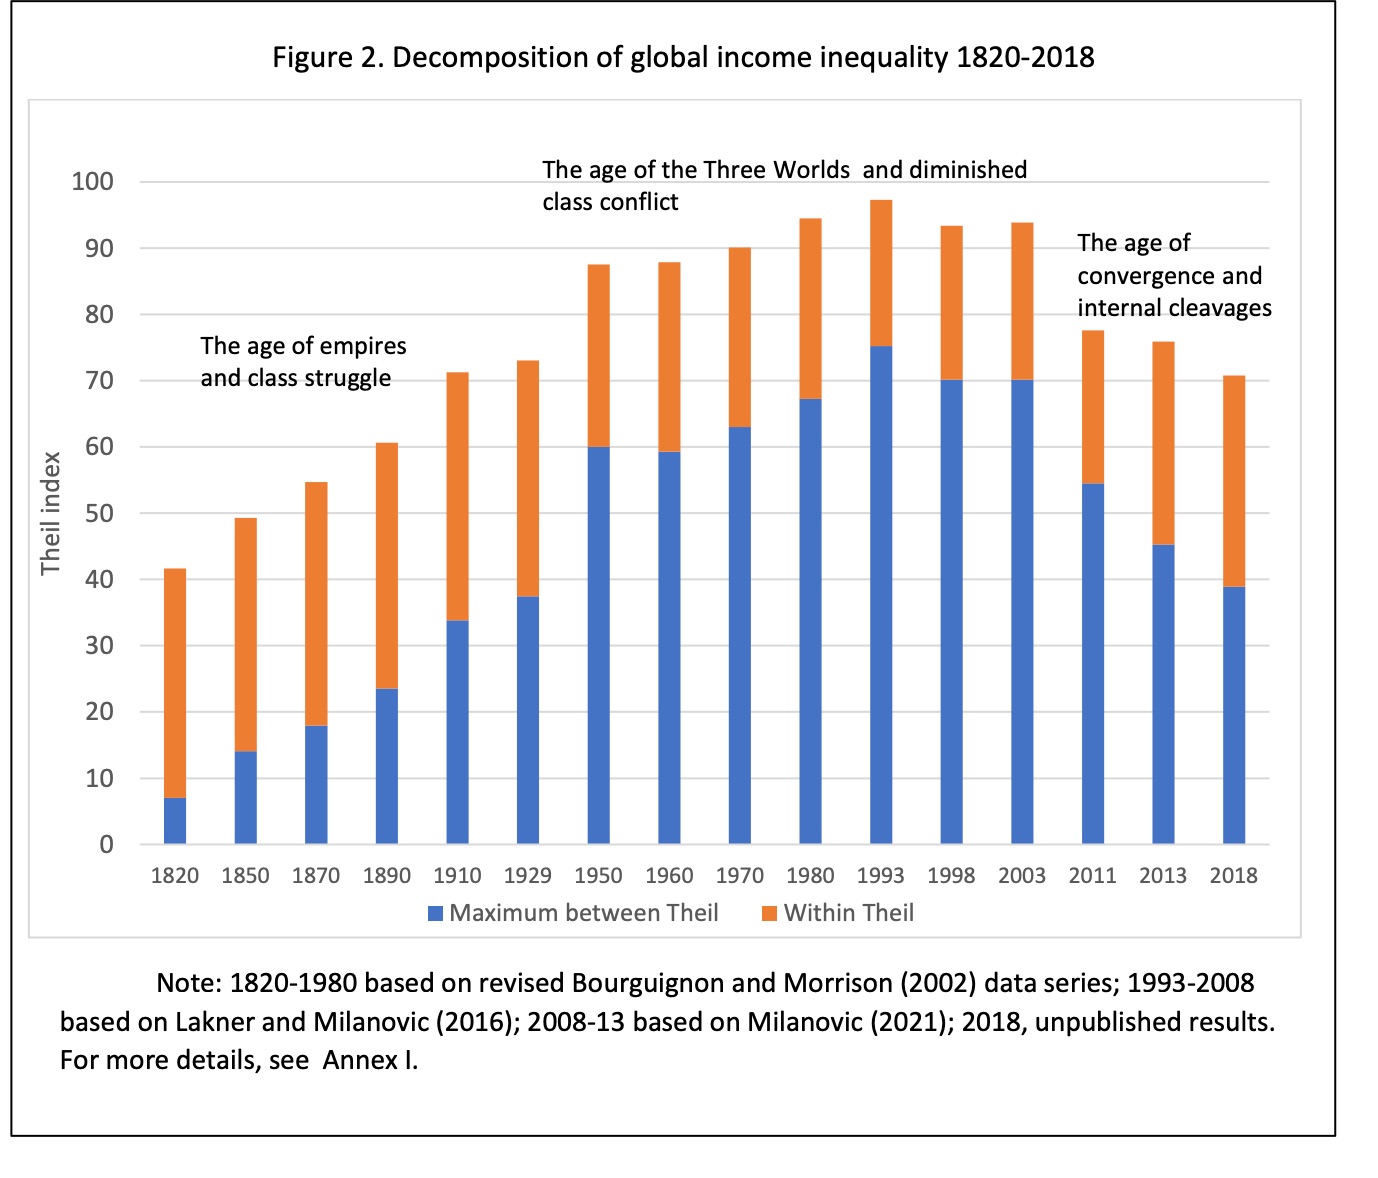
5. Our graph illustrates when the “three worlds” diverged and comverged.
Showing increasing inequality, the bars on our graph ascend, reach a peak in 1993, and then start the move toward convergence. At the samwe time, we can compare inequality within countries and between them through the length of the orange and blue sections of the bars. Since incomes diverge in coiuntries and between them in the first era, both trends exacerbate inequality.Then though the divide in countries (like the U.S., Japan and France) shrinks because of social and tax policies until most recently, when the orange bars elongate again.
Because the first stage was characterized by divergence and the third by convergence, we could say they are mirror images:
6. China’s growth is the main reason for less global inequality.
As the home of one-quarter to one-fifth of the world’s population, the ascent of the Chinese economy had a profound impact on global inequality. Then, when we add India and other Asian nations to the equation, we get data that push the world even more so toward convergence. Dr. Milanovic points out though that now, with China having reached more affluence, its growth can no longer boost global equality as much.
Our Bottom Line: Theil
We’ve looked at Gini and Lorenz in the past as inequality indices. Now, we now can add the Theil Index. Most accurately, we can classify it as an entropy class index but let’s quickly move onward to simpler territory and just say it requires some elegant math. Called the Theil T and the Theil L, both involve population, income, average income, ratios, logarithms, and then some adding. The result is a Theil statistic.
Please stop here unless you find the following interesting:

To get a snapshot of U.S. inequality, statisticians add all the Thiels for all the states and then track its ups and downs.

My sources and more: Thanks to the Financial Times for alerting me to the Milanovic paper. All graphs and facts except my explanation of the Theil Index are from the Milanovic paper. My third source with all we needed to know about the Thiel Index was the tutorials at the University of Texas Inequality project


