Hyman P. Minsky was an economist who worked at Brown, Berkeley, Washington U. and the Mark Twain Bank in St. Louis. Perhaps reflecting the synergy between an academic and a business background, more than 25 years ago, he described a boom bust sequence that we seem unable to avoid.
The Minsky Moment
Moving from a “hedge” to “speculation” to a “Ponzi” phase, the stages of lending in the U.S. housing crisis were just what Minsky predicted. In the beginning of the cycle, financial institutions loan money to home buyers who can afford to service debt and pay back principal. However, as their demand boosts home prices and spreads a wealth effect, lower lending standards open markets to more buyers. With speculation intensifying, borrowing standards further plunge as buyers and lenders realize that increasing prices facilitate the resales and refinancing they need to buy unaffordable homes. Once prices stop rising, like a Ponzi scheme, it all collapses in what has been called a Minsky Moment.
The Housing Chronology
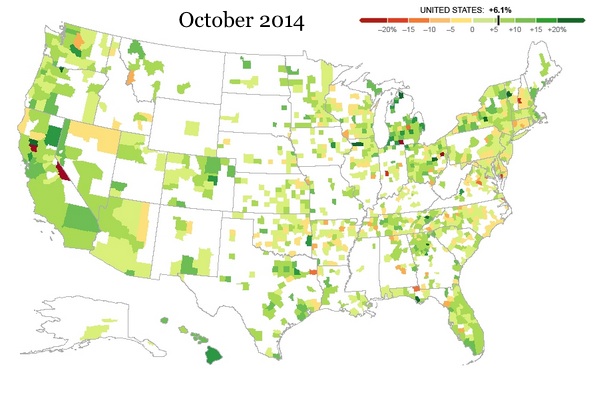
The following sequence of NY Fed maps, lets us compare monthly home prices to where they were the previous year. Moving closer to a Minsky Moment, most counties on the Fed’s 2006 map (below) display rising home prices.

Way beyond a five percent “sweet spot,” during 2005, home price increases in California and Florida exceeded 25 percent. By contrast, below, we can see the first seconds of a Minsky Moment.

While county by country housing markets vary, still the spread of the Minsky Moment was unfolding with more defaults and subsequent foreclosures.

And continuing.

And continuing.

And continuing.

Here, the NY Fed suggest prices had reached their nadir and begun to rise.

And rise.

And now, a slowdown toward that five percent sweet spot for home price increases?

And here it is, animated.
Our Bottom Line: Business Cycles
As the four stages of a business cycle–peak, contraction, trough, expansion–unfold, housing can provide signals about where the economy is going. In an Econtalk discussion, UCLA economist, Ed Leamer points out that most of the recessions that followed World War II were preceded by housing problems.
Looking at the trajectory of the business cycle before and during the Great Recession, we see a trough in November 2001, expansion until a peak in December 2007, and then the contraction that ended in June 2009. In our housing price maps, you can see the Minsky Moment that foreshadows the beginning of the December 2007 contraction.


