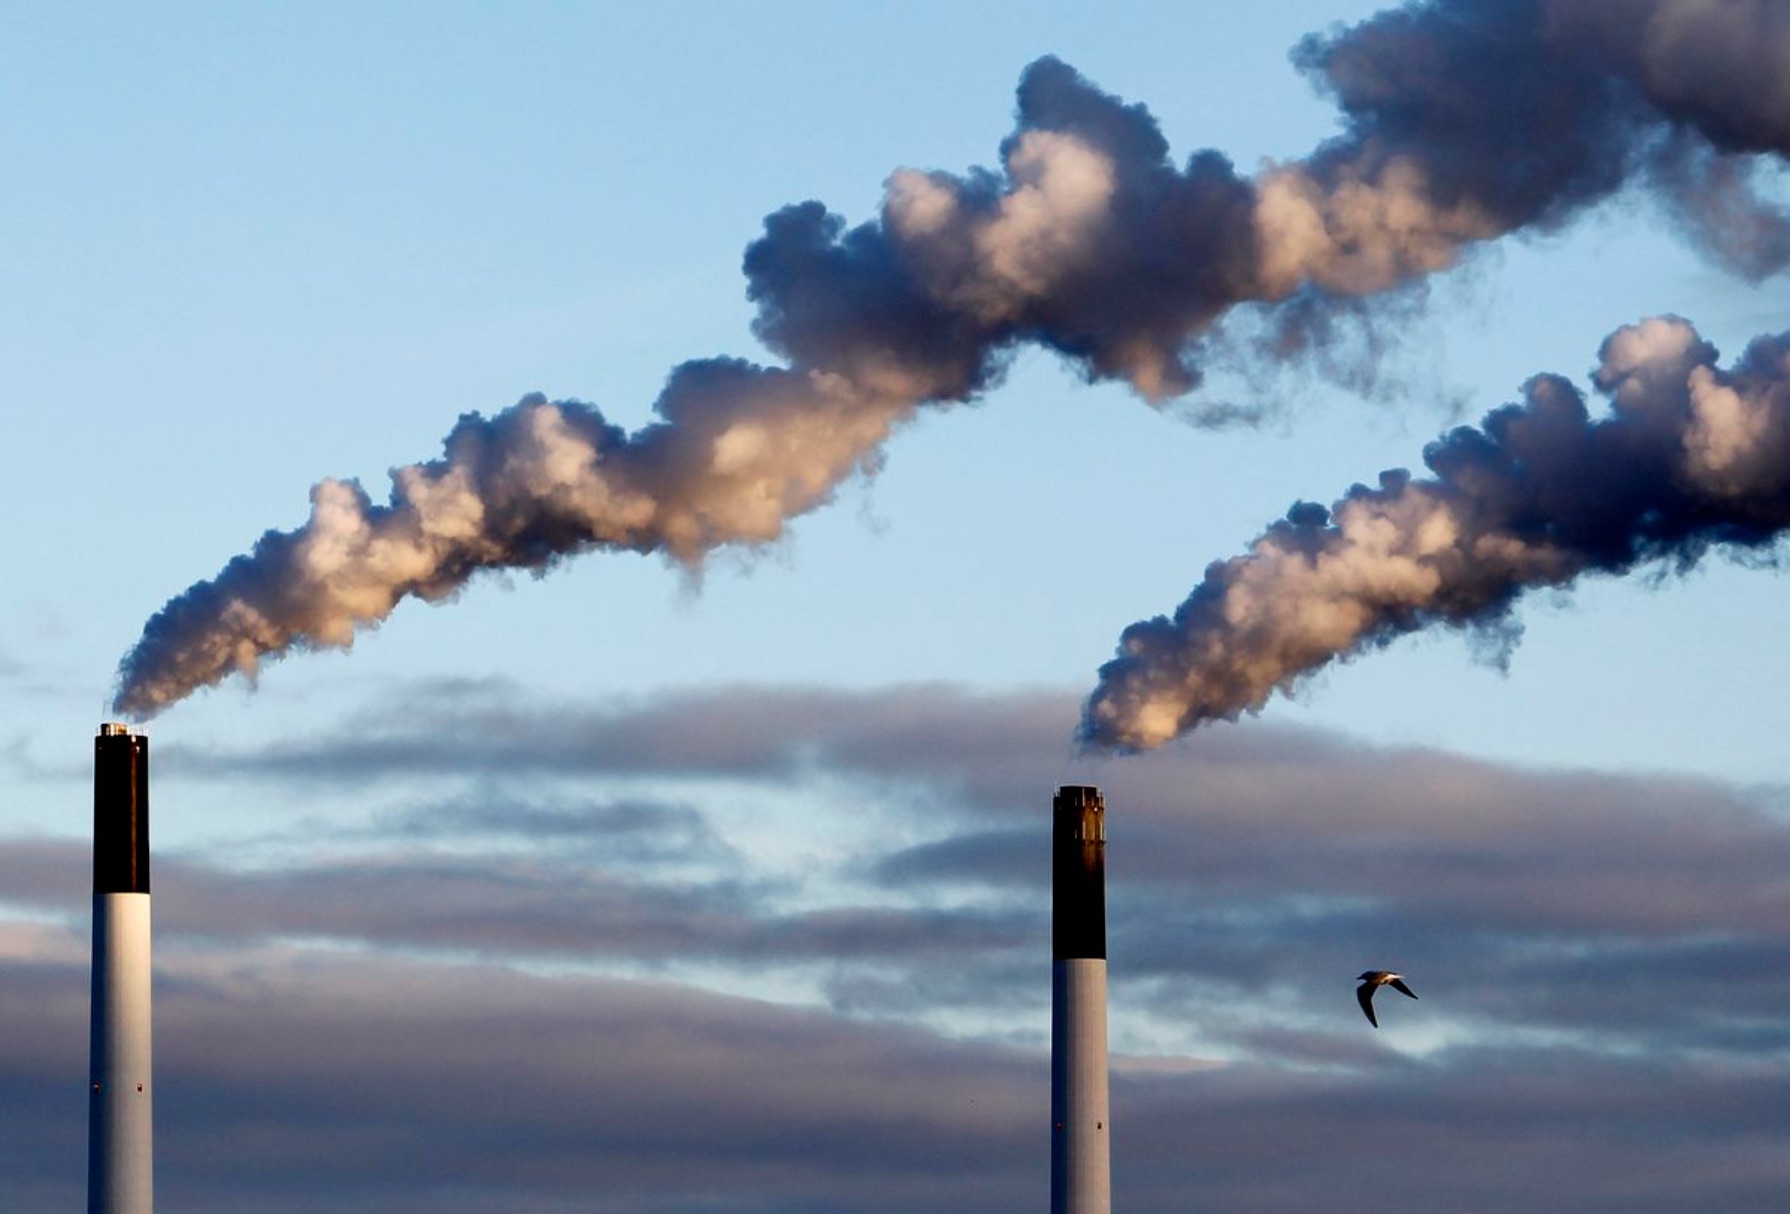
A carbon tax is one remedy for global warming but it’s not quite that easy.
Sort of like Goldilocks, we have taxes that are too high, some that are too low, and others that are just right.
Carbon Taxes
Let’s start with no tax. Then, the benefit of carbon emissions goes to the businesses producing pollution and to the consumers who buy their products. Meanwhile, the cost is divided among a population that breathes polluted air. Economists would say that no tax creates market failure because the market has failed to include the social and dollar cost of the harm from the emissions.
Below, you can see that the lower equilibrium price displays market failure. Then, when supply becomes more costly, it decreases and shifts to the left:
The Tax
When government does decide to levy a tax, its size should depend on how it impacts business activity and climate change. The business side is a cost and the climate impact is a benefit. Always though, as economists, we don’t want the marginal cost to exceed the marginal benefit.
The conventional wisdom tells us that we should target a 1.5°C. (2.7°F.) increase. Scientist hypothesize that we would need to reduce CO2 emissions by 45 percent by 2030 and then zero by 2050. And even then, the projection suggests that 70 percent of all coral reefs would perish.
Meanwhile, Nobel economic laureate William Nordhaus shows us his cost and benefit conclusions:

Actual Taxes
I’ve copied a World Bank graph that displays carbon prices as of April 1, 2022. To the list we could add a recent decision by Denmark that placed its CO2 corporate levy as the highest in Europe at 1,125 Danish crowns ($159) per tonne by 2030.
Our Bottom Line: Pigovian Taxes
First described by British economist Arthur Pigou, a tax levied on a good or service that created pollution has a dual benefit. Pigovian taxes diminish the supply of the commodity that harms us while generating revenue that a community can use productively.
In this 2022 World Bank map, the locations of Pigovian carbon taxes are shown in blue. Other colors represent where countries have implemented or are planning emissions trading systems:
 The result? For 2022, the World Bank gives us some summary numbers:
 My sources and more: For the big picture, the World Bank has an annual emissions report from which I got my map while Reuters had the Denmark carbon tax story. But the book that I recommend most enthusiastically for its climate chapters and much more is Duflo and Banerjee’s Good Economics For Hard Times. Please note that some of today’s sections were in a previous econlife post. Also, our featured image is from REUTERS/Yves Herman.


Rough estimates like Nordhaus’s are misleading in uncertain situations with extreme non-linearity. Enormous positive feedback from methane emissions caused by warming of boreal peat and permafrost is ignored in most climate models because of reluctance to be accused of scare-mongering when the science is uncertain. This applies even more to the possibility of major methane emissions from ocean warming of methane clathrates at the edges of cool-temperate continental shelves.
Thanks Rick. Yes, I was surprised by the Nordhaus graph.