![econlifelogotrademarkedwebsitelogo[1]](/wp-content/uploads/2024/05/econlifelogotrademarkedwebsitelogo1.png#100878)


How Airplane Real Estate Varies With Your Seat
May 31, 2022
Why Theaters Could Have Popcorn Problems
June 2, 2022
This year, MLB home runs are down. According to CBS Sports, as of May 6, the team average was .9 per game, down from last year’s 1.22 and a whopping 1.39 in 2019.
But before we look at home run economics, let’s consider some home run history.
Home Run History
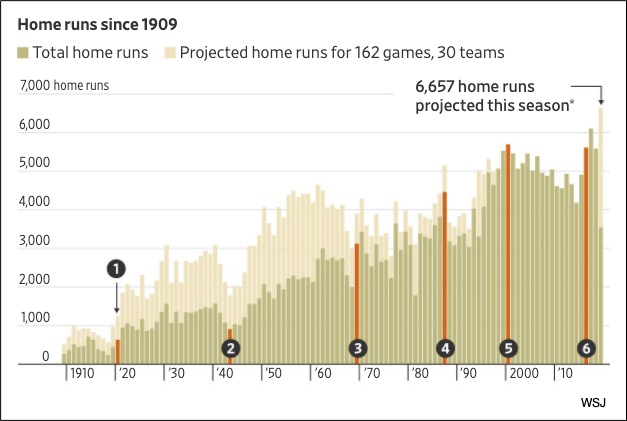
Home run totals are somewhat inconsistent. The following graph ends with the beginning of the 2019 season. It shows us the last 100 years:
Below, you can see the actual numbers during the past decade:

Explaining the inconsistency, CBS Sports talks about how player angles for the “launch” differed. They also referred to the ball’s bounciness and its seam length. They then tell us that 2019 post season balls carried 4.5 fewer feet. The reason, they hypothesize, was that MLB ran out of regular 2019 season balls after using more for games and memorabilia. Then, in 2021, because of supply chain disruptions, MLB had two batches, a lighter ball that carried less and a heavier one that was livelier.
The following table was published during the beginning of May 2022. (There were just 60 games in 2020.):
Our Bottom Line: Land, Labor, and Capital
As economists, we can look at baseball through a lens that focuses on the three factors of production. Like all goods and services, home run production comes from land, labor, and capital. It relates to the stadium (on land) and to the players (labor). Meanwhile, capital includes the balls and the humidors in which they are stored. So, we can ask which of the three factors of production changed to reduce home run totals in 2022.
It appears to be the capital.
The land is a constant. Then, as for labor, CBS Sports tells us that the players are hitting balls harder than ever at the same launch angle but without getting the distance. Looking at barrels (“the best possible contact in terms of exit velocity and launch angle”), exit velocity has been relatively high. However, average distance is down:

Experts suggest there could be two reasons. It could be the baseball. One commentator says, so far, we have had a “high drag” year. In other words, the air is slowing the ball more. This corresponds to the MLB announcement that there was a production change to a lighter ball for 2022. Also, it is possible that the expanded use of humidors in all 30 stadiums has had an impact. Used for storage, the humidors dry balls in moist climates and “wets” them when it’s drier. It is possible that humidor storage is deadening the balls. During 2021, the home run rate was lower in the 10 stadiums that used the humidor.
So, where are we? We can even use economic analysis to better understand home run rates.
My sources and more: Perhaps with all we need to know about baseball land, labor, and capital history, this CBSSports article was ideal. Then, WSJ had the baseball story, and this Washington Post article has more about launch angles. (Our featured image is from WSJ.)


