![econlifelogotrademarkedwebsitelogo[1]](/wp-content/uploads/2024/05/econlifelogotrademarkedwebsitelogo1.png#100878)


When Daylight Saving Is Not the Best Time
March 8, 2020
Where to Find Gender Inequality
March 10, 2020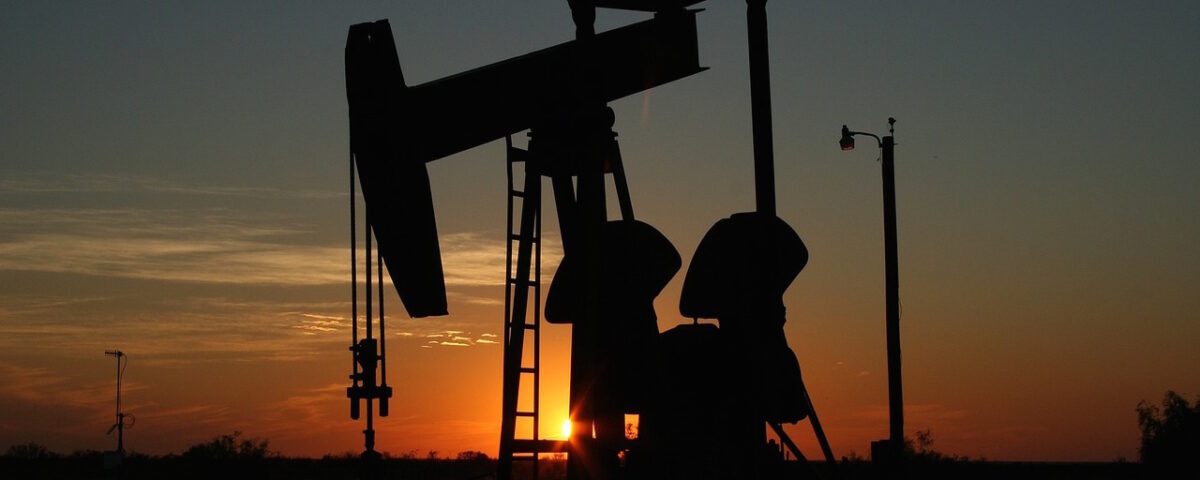
With the price of oil plunging, let’s look at the past, the present, and maybe get some insight about the future.
Six Facts About Our Oil Supply
1. Between 1965 and 2017 the U.S., the Russian Federation (or the U.S.S.R.), and Saudi Arabia were pretty consistently the top three oil producers.
The shale revolution took the U.S. to the top spot. But do take a look at the ups and downs of the top three as well as other countries like Venezuela and Norway. It is a fascinating 45 seconds:
https://www.youtube.com/watch?v=YPvl2UdXpBs
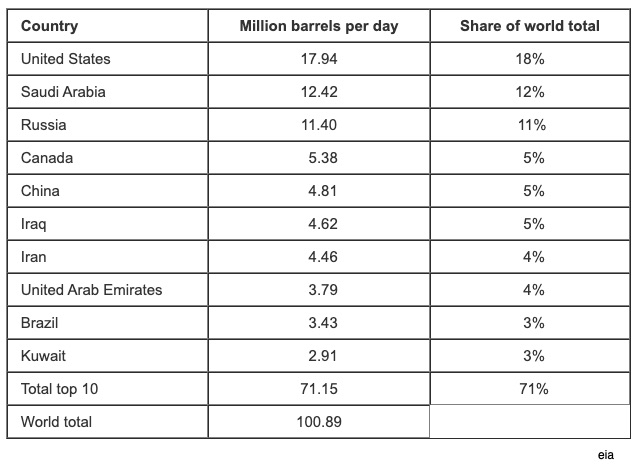
2. In 2018, at 18%, the U.S. was by far, the world’s top oil producing country.
The 2018 data are the most recent numbers from the eia (U.S. Energy Information Administration) about the world’s 10 largest producers. Their definition of oil covers “crude oil, all other petroleum liquids, and biofuels:”
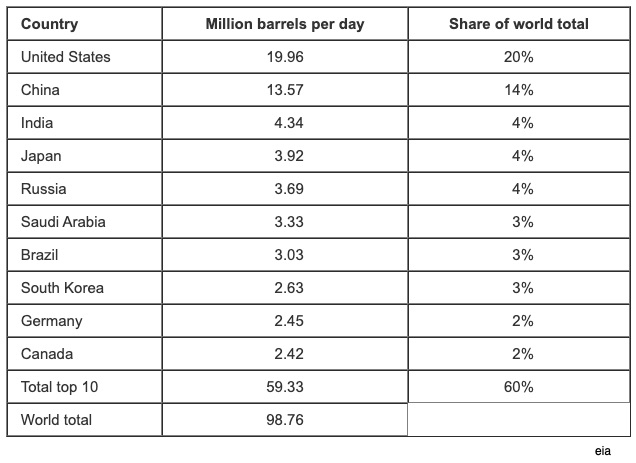
 3. Also, the U.S. was the world’s biggest oil consuming country in 2017.
With China in the #2 spot, you can see why its recent decrease in demand would reverberate throughout the world’s oil prices:
 4. Since 1865, the price of oil has fluctuated massively.
Using 2014 prices, a team for Goldman Sachs graphed the vagaries of oil prices from 1865 to 2016. You can see that prices dropped because of recessions in 1890-92, 1931, and 2008 and because of oversupply in 2015. Meanwhile, price peaks relate to cuts in production for reasons that range from an embargo (1973-74) to wars (2011) and also to spurts in demand (1920):

5. The price of oil has swung back to its lows during 2016.
As recently as 2011, the per barrel price touched $120. On March 6, 2020, the WTI price (West Texas Intermediate–a domestic yardstick) was $41.28. But then last night, it plunged to the vicinity of $30 ($27.20 in 2014 prices):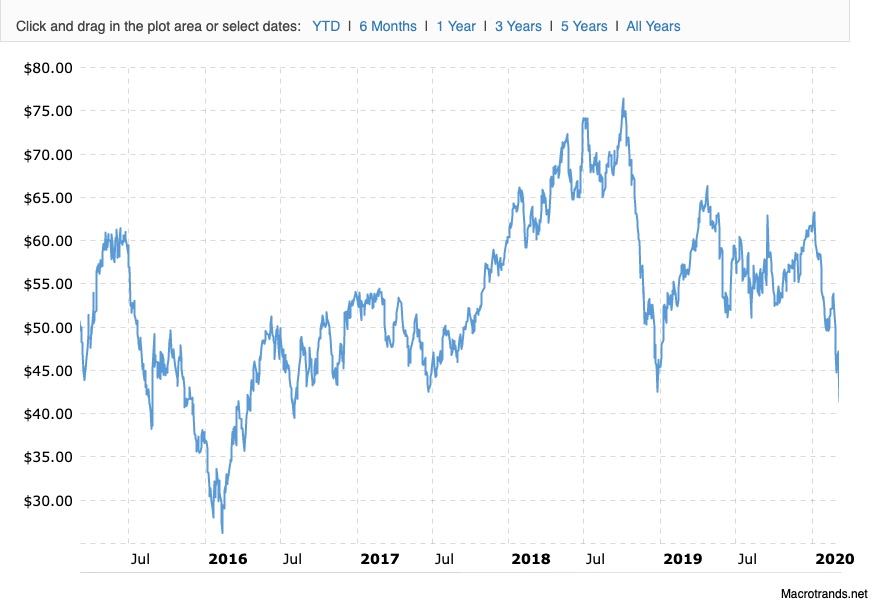
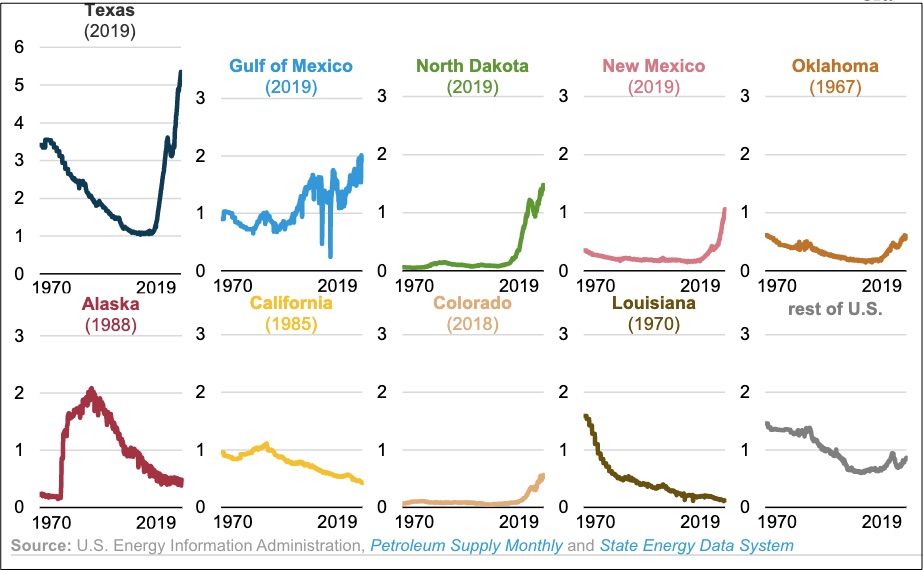
6. Texas still dominates oil production in the U.S.
Now that the price is plunging, producers will have the incentive to cut back:
Our Bottom Line: Supply
From one 42 gallon barrel of oil, we wind up with 45 gallons of petroleum products. Sort of like popcorn, the oil total increases during refining. It winds up in thousands of products that are a part of the supply side of the U.S. economy:
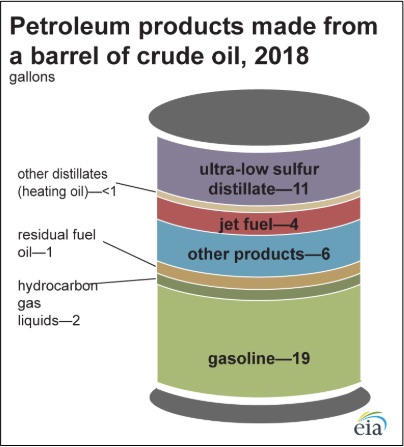
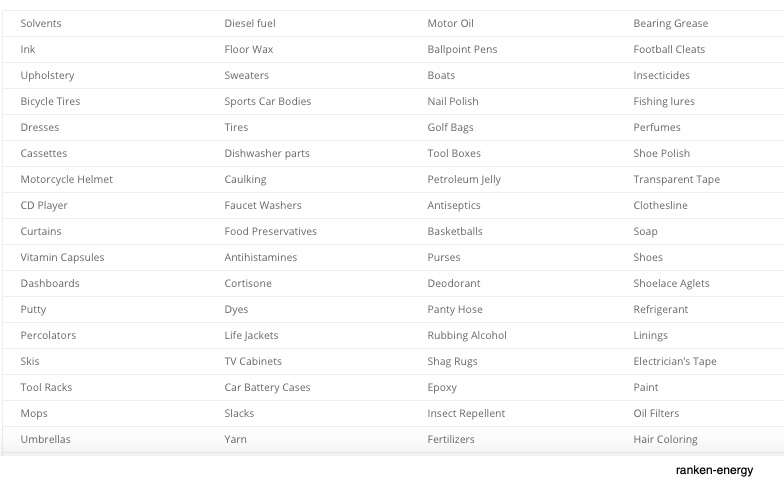
While 19.4 gallons of a barrel of oil becomes gasoline, the rest of the barrel is used for items that include the following list:
So, whether it’s because of less Chinese demand or a Russia/Saudi dispute, when the price of oil plunges, the supply side of the U.S. economy will feel the fall.
My sources and more: The eia, here and here is always ideal for oil industry stats. As for oil prices, WEF had the best history. Also please note that most of my data did not distinguish between WTI and Brent but still, you can get the basic picture.


