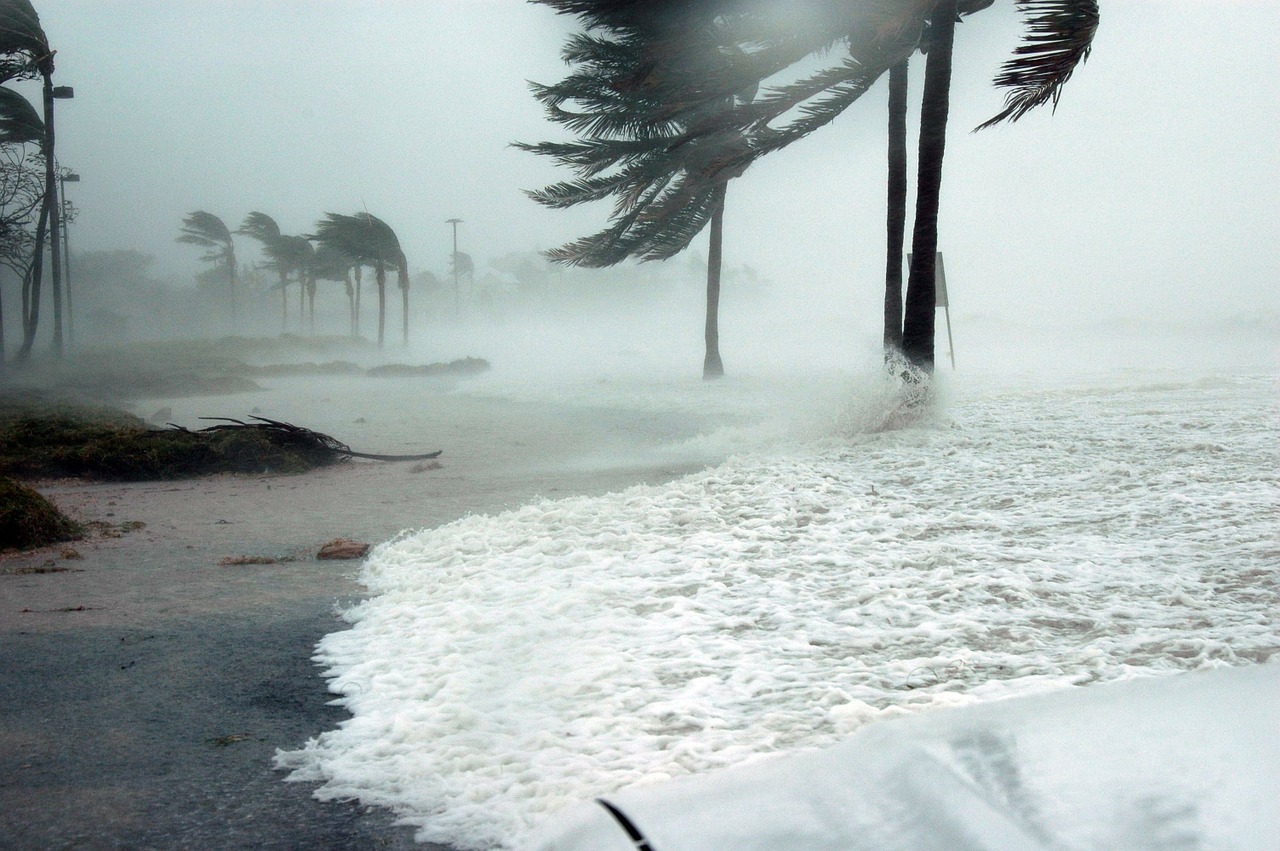
We’ve moved beyond Alberto, Beryl, Chris, Debby, and Ernesto. Meanwhile, Florence, Gordon, Helene, and Isaac are in the news. And we might soon learn about Joyce, Kirk, and Leslie. As for the rest, these names complete the 2018 hurricane list:
- Michael
- Nadine
- Oscar
- Patty
- Rafael
- Sara
- Tony
- Valerie
- William
In a recent paper, an economic team studied the impact of hurricanes and other natural disasters on migration. Others have focused on the GDP.
So let’s take a look.
Six Facts
1. We could say that the most disaster prone regions of the U.S. are along its coasts and river plains.
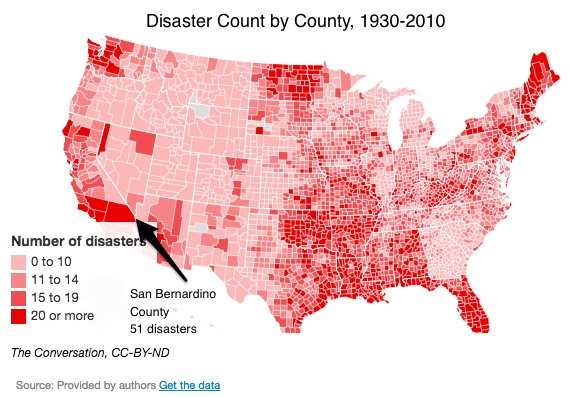
In the following maps, you can see a disaster landscape that was divided into two categories. A severe disaster was defined as causing 10 or more deaths whereas those that were super-severe involved 100 or more fatalities.
At 51, California’s San Bernardino County seems to have had the most disaster hits:
But you will see in the next map that with 3 (or so) during each decade, San Bernardino was lower on the super-severe scale. For the most super-severe disasters, several Pennsylvania counties had an 80-year record of 5 (on average) every 10 years. Below, you can see which areas were most vulnerable:
2. Many of us experience two (or so) natural disasters during every ten years.
Floods, and then storms and hurricanes, are the most common types of natural disasters in the U.S. A list of all kinds would include tidal waves, tornados, droughts, volcano eruptions, landslides, forest fires and extreme temperatures. A typical county in the U.S. experiences 1.97 of these kinds of disasters a decade.
3. Super-severe disasters create out-migration of the “non-poor.” One result could be a higher poverty rate.
People who can afford to leave are the ones who migrate from the areas that experience the worst disasters. In a typical county, the number could be as high as 600 after two disasters occurred. The result is a remaining population with more poverty.
4. A natural disaster can boost the GDP.
Yes, as a recovery unfolds, we could see a boost in the GDP because people are rebuilding whatever has been destroyed.
5. A post-disaster GDP boost has an opportunity cost.
Defined as the next best alternative, the opportunity cost of a decision is what you did not do. Before, during, and after natural disasters, land, labor and capital are mobilized to fight the calamity. As a result, they are used to rebuild what had previously existed. The emphasis is replacement rather than the opportunity cost, progress. The replacement construction could indeed be much better than what had existed. But it is still replacement.
6. The Broken Window Fallacy is one way to explain the economic impact of a disaster.
In “What is Seen, and What is Not Seen,” economist Frédéric Bastiat (1801-1850) reminds us of what we are not doing as we recover from a calamity. When a window is broken, the glazier gets employment and the GDP rises. However, we just wind up with the window we had once had. Or, as he said, “To break, to spoil, to waste, is not to encourage natural labour; or, more briefly, ‘destruction is not profit.'”
Our Bottom Line: Inequality
Six facts can never summarize the economics of a disaster. Because cost is so much more than money and because a poorer population and poorer nations have fewer resources, the impact is so much more complex than six facts can possibly recognize.
But they are a beginning.
My sources and more: With Hurricane Florence in the news, this paper on the impact of natural disasters and this summary were especially relevant. They were offset by some disagreement though in this St.Louis Fed paper on natural disaster economics. Also, if you want to read about the international connection, this brief Brookings paper is a possibility.
After publication, this post was slightly edited to improve clarity.


