![econlifelogotrademarkedwebsitelogo[1]](/wp-content/uploads/2024/05/econlifelogotrademarkedwebsitelogo1.png#100878)


An Avocado Update
June 2, 2019
What a Supermarket Thinks About the Census
June 4, 2019
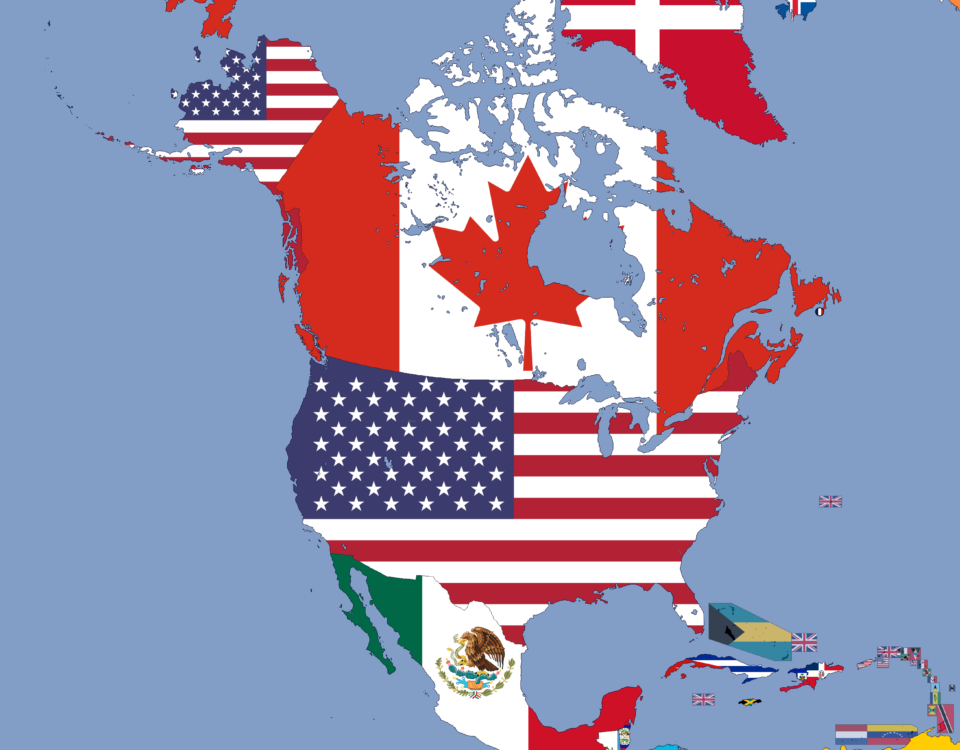
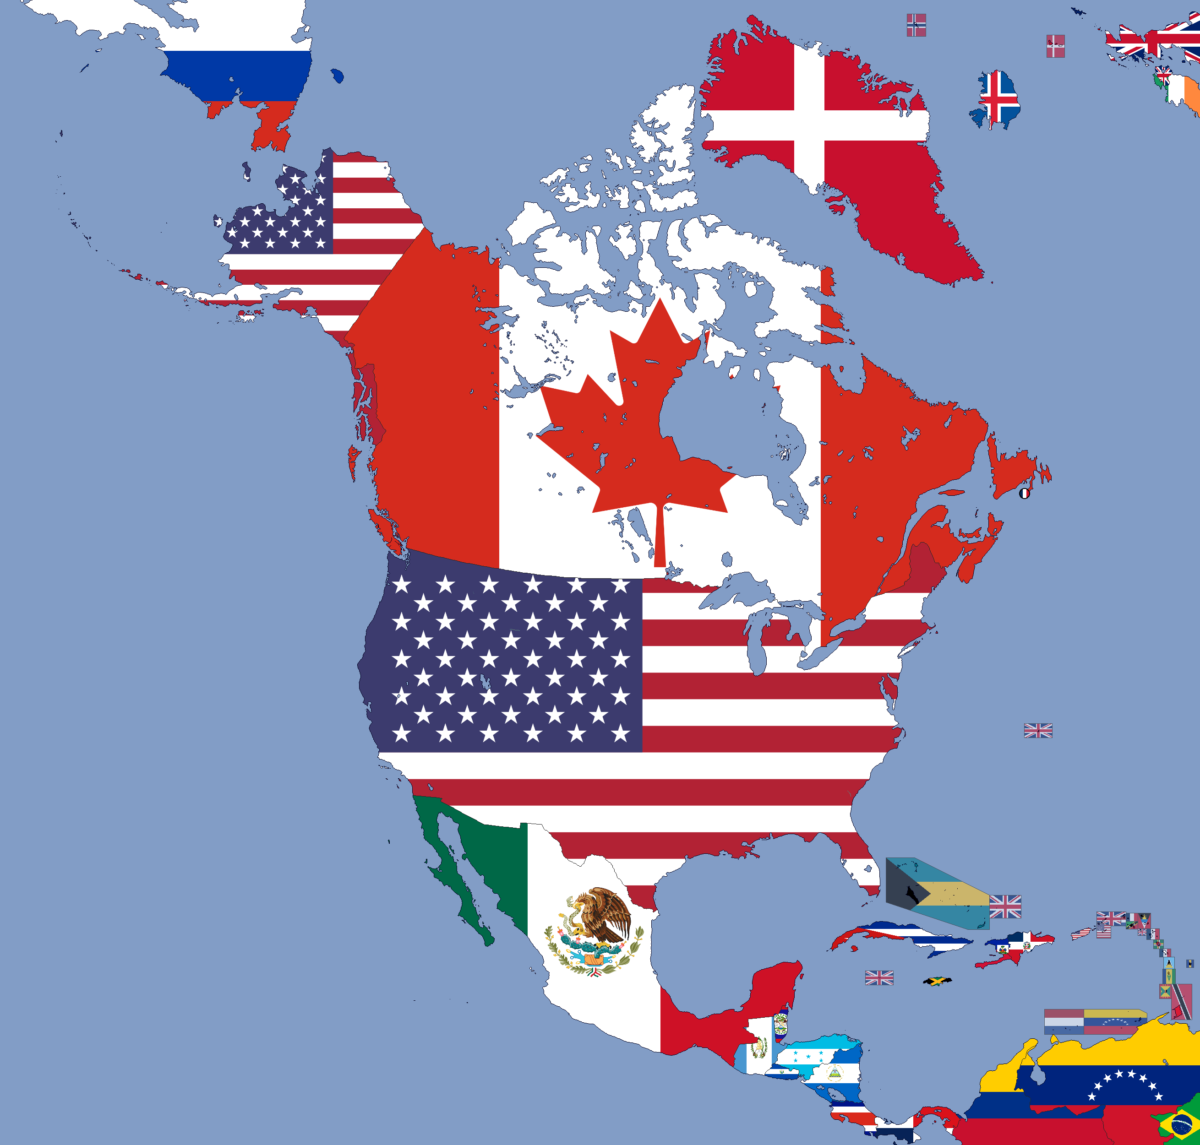
In 2019, the cross border trade between the U.S. and Mexico became the largest in the world. So yes, we can imagine a massive amount of goods coming from and going to Mexico:
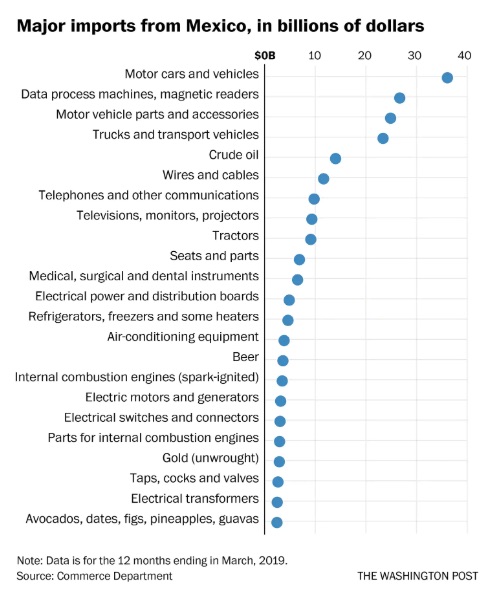
But then it becomes a bit more complicated.
Autos and Mexican Tariffs
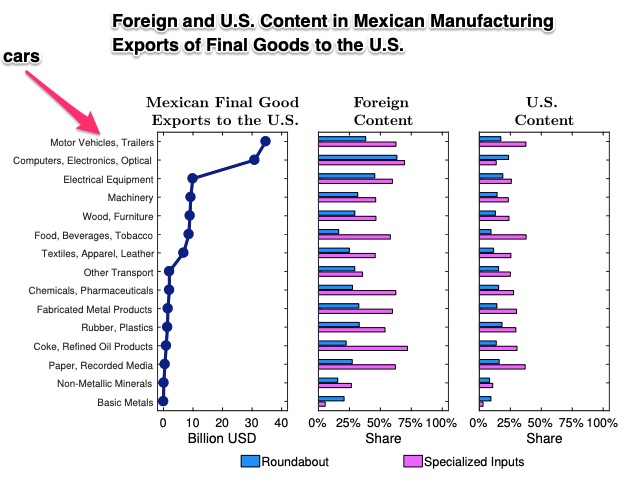
In a recent paper, Princeton economist Alfonso de Gartori estimates that a whopping 74% of the foreign inputs in Mexican auto part exports come from the U.S. Then, looking more closely, he concludes that U.S. content in Mexican exports to the U.S. averages 30%:

That means a “Made in Mexico” label should also say “Made in the USA.” And yes, you can see below that there is U.S. content in a vast array of Mexican exports to the U.S.:
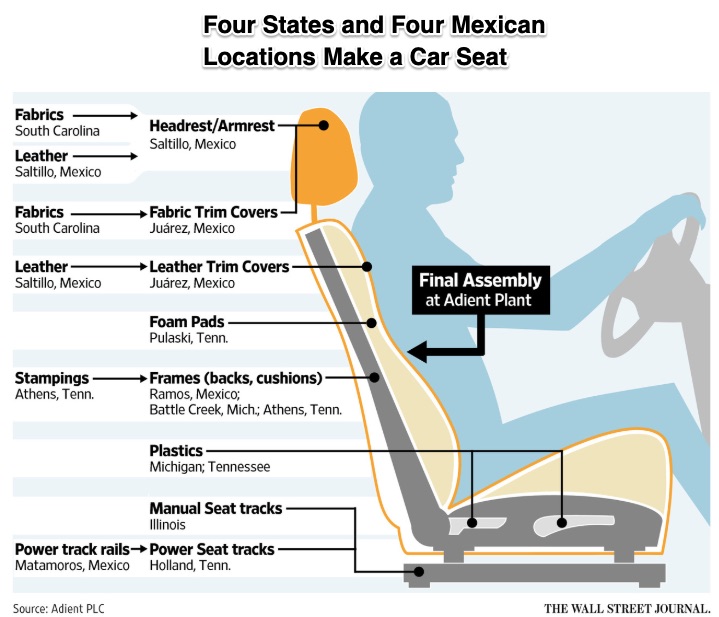
Car Seats
To get a better picture, though, please just imagine the seat on which you sit in your car.
Moving among four U.S. states and four Mexican locations, in 2016, the components of a car seat took a rather long journey before they wound up in an auto. As for 2019, we can be sure that the same back and forth movement continues. Thousands of auto parts can move across the U.S.-Mexican border before finally residing in one car:
Our last step is “where.”
Where Do Imports From Mexico Go?
You can see that Arizona and Michigan are the biggest receivers of imports from Mexico while Maine and Vermont are close to the bottom of the list:
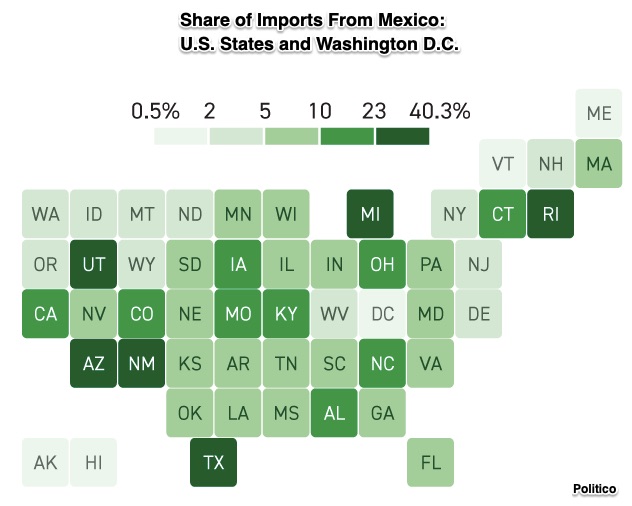
The most:
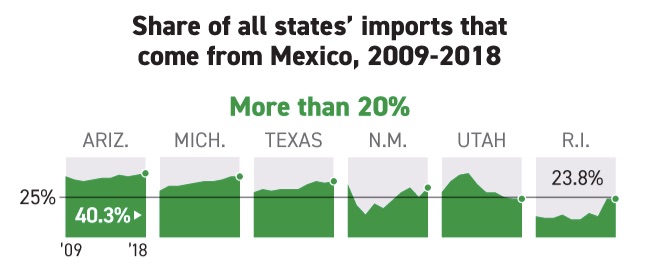
The least:

Our Bottom Line: Tariffs on U.S. Imports From Mexico
President Trump has said that on June 10, he will levy a 5% tariff on U.S. imports from Mexico. From there, it is possible that on the first of every month, the tax could rise by another 5%.
So, when you think of tariffs on imports from Mexico, do imagine a “Made in the USA” label.
My sources and more: Still relevant today, this WSJ article told about the travels of a car seat. Meanwhile, the Washington Post has more about the Trump tariffs’ impact and Politico had the states data for us. Then, to anchor it all with an academic perspective, I downloaded (gated) this NBER paper by Princeton economist Alonso de Gartori.
Our featured image is from Pixabay.

