Asked who pays the most taxes, you could say, “married people.”
Where are we going? To three handy tax facts.
Marriage and Taxes
Fact #1: Married people pay more.
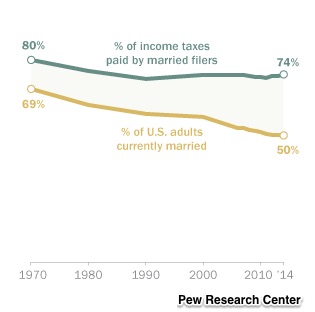
Although marriage is on the decline in the U.S., married couples still pay the vast majority of tax dollars. Comparing 1970 to 2014, the proportion of adult Americans who married dropped from 69% to 50%. And yet the tax dollars paid by people with spouses remained somewhat constant.
Below you can see that during those 44 years, the income tax dollars from married couples fell by just 6% of the total collected. But there were 19% fewer married adults:
When we look for why, one answer takes us to education. People with college degrees are more likely to marry and to earn more than those with just a high school diploma.
The dollar difference is big. The married college couple or married individual earns an average of $115,100–more than three times the $35,200 declared by the person with four years less school. So yes, you have the education premium and also the boost from a two income household.
Affluence and Taxes
Fact #2: The top 10% is paying more.
Looking way back, the IRS listed the highest bracket tax rates since the income tax began. Do note though that tax rates can be misleading. We have not included the loopholes that diminish the actual rate:
- 1913: 7% 1980: 70%
- 1921: 73% 1988: 28%
- 1931: 25% 2000: 39.6%
- 1945: 94% 2002: 38.6%
- 1963: 91% 2017: 39.6%
So yes, in 1980, you would find that the highest tax bracket was 70%. Now at 39.6%, the top earners are paying a lower rate. However, the rate has not reduced the proportion of tax revenue that comes from the top 10%. In 1980, that total was 32% of all adjusted gross revenue. For 2013, it rose to 46%.
Our Bottom Line: Simplicity and Taxes
Fact #3: The best tax act.
If you believe the best tax is a simple tax, then 1986 is your year.
Before the Tax Reform Act of 1986 was passed, the person who earned $23,000 of taxable income paid 7 different rates:
For a top earner, the number of brackets increased to 25 different rates.
Then the 1986 Act transformed the system. Officially there were just 15% and 28% brackets. Even with a 33% rate for some tax payers, it all became magically simple.
The one constant? Revenue depends on married people.
My sources and more: This NPR survey was the perfect starting point. Then Pew had the facts on taxes paid by married Americans. And finally, the IRS and the Tax Policy Center had the rate details.
These were the notes that Pew included with their graph:


