![econlifelogotrademarkedwebsitelogo[1]](/wp-content/uploads/2024/05/econlifelogotrademarkedwebsitelogo1.png#100878)


6 Facts: What We Need to Know About Diesel
September 13, 2026
6 Facts: How Trading With Canada Has Changed
September 15, 2026
Knowing that personal and commercial driving decisions affect the GDP, we care about gas prices. In addition, planning for the future, people who range from refiners to policymakers need to know when we will drive less or more.
It all relates to our elasticity.
Gasoline Prices
Economists used to think that in the short run (before having time to adjust), we responded minimally to a change in gasoline prices. After all, we have to commute to work and take the kids to their activities. However, a 2020 paper from the Dallas Fed disagreed.
First, they looked at the price of gas. Then they explained why previous studies lacked the data they now had. They pointed out that more recent studies were more accurate because they could separate buying behavior from demand and just see the response to price. A 2016 paper also had access to credit card purchases that let them separate regions and see what individuals bought. Distinguishing it from past aggregate data bias, that study used individual purchases from 243 cities. As they explained, the past aggregate approach masked individual behavior.
Our Bottom Line: Gas Elasticity
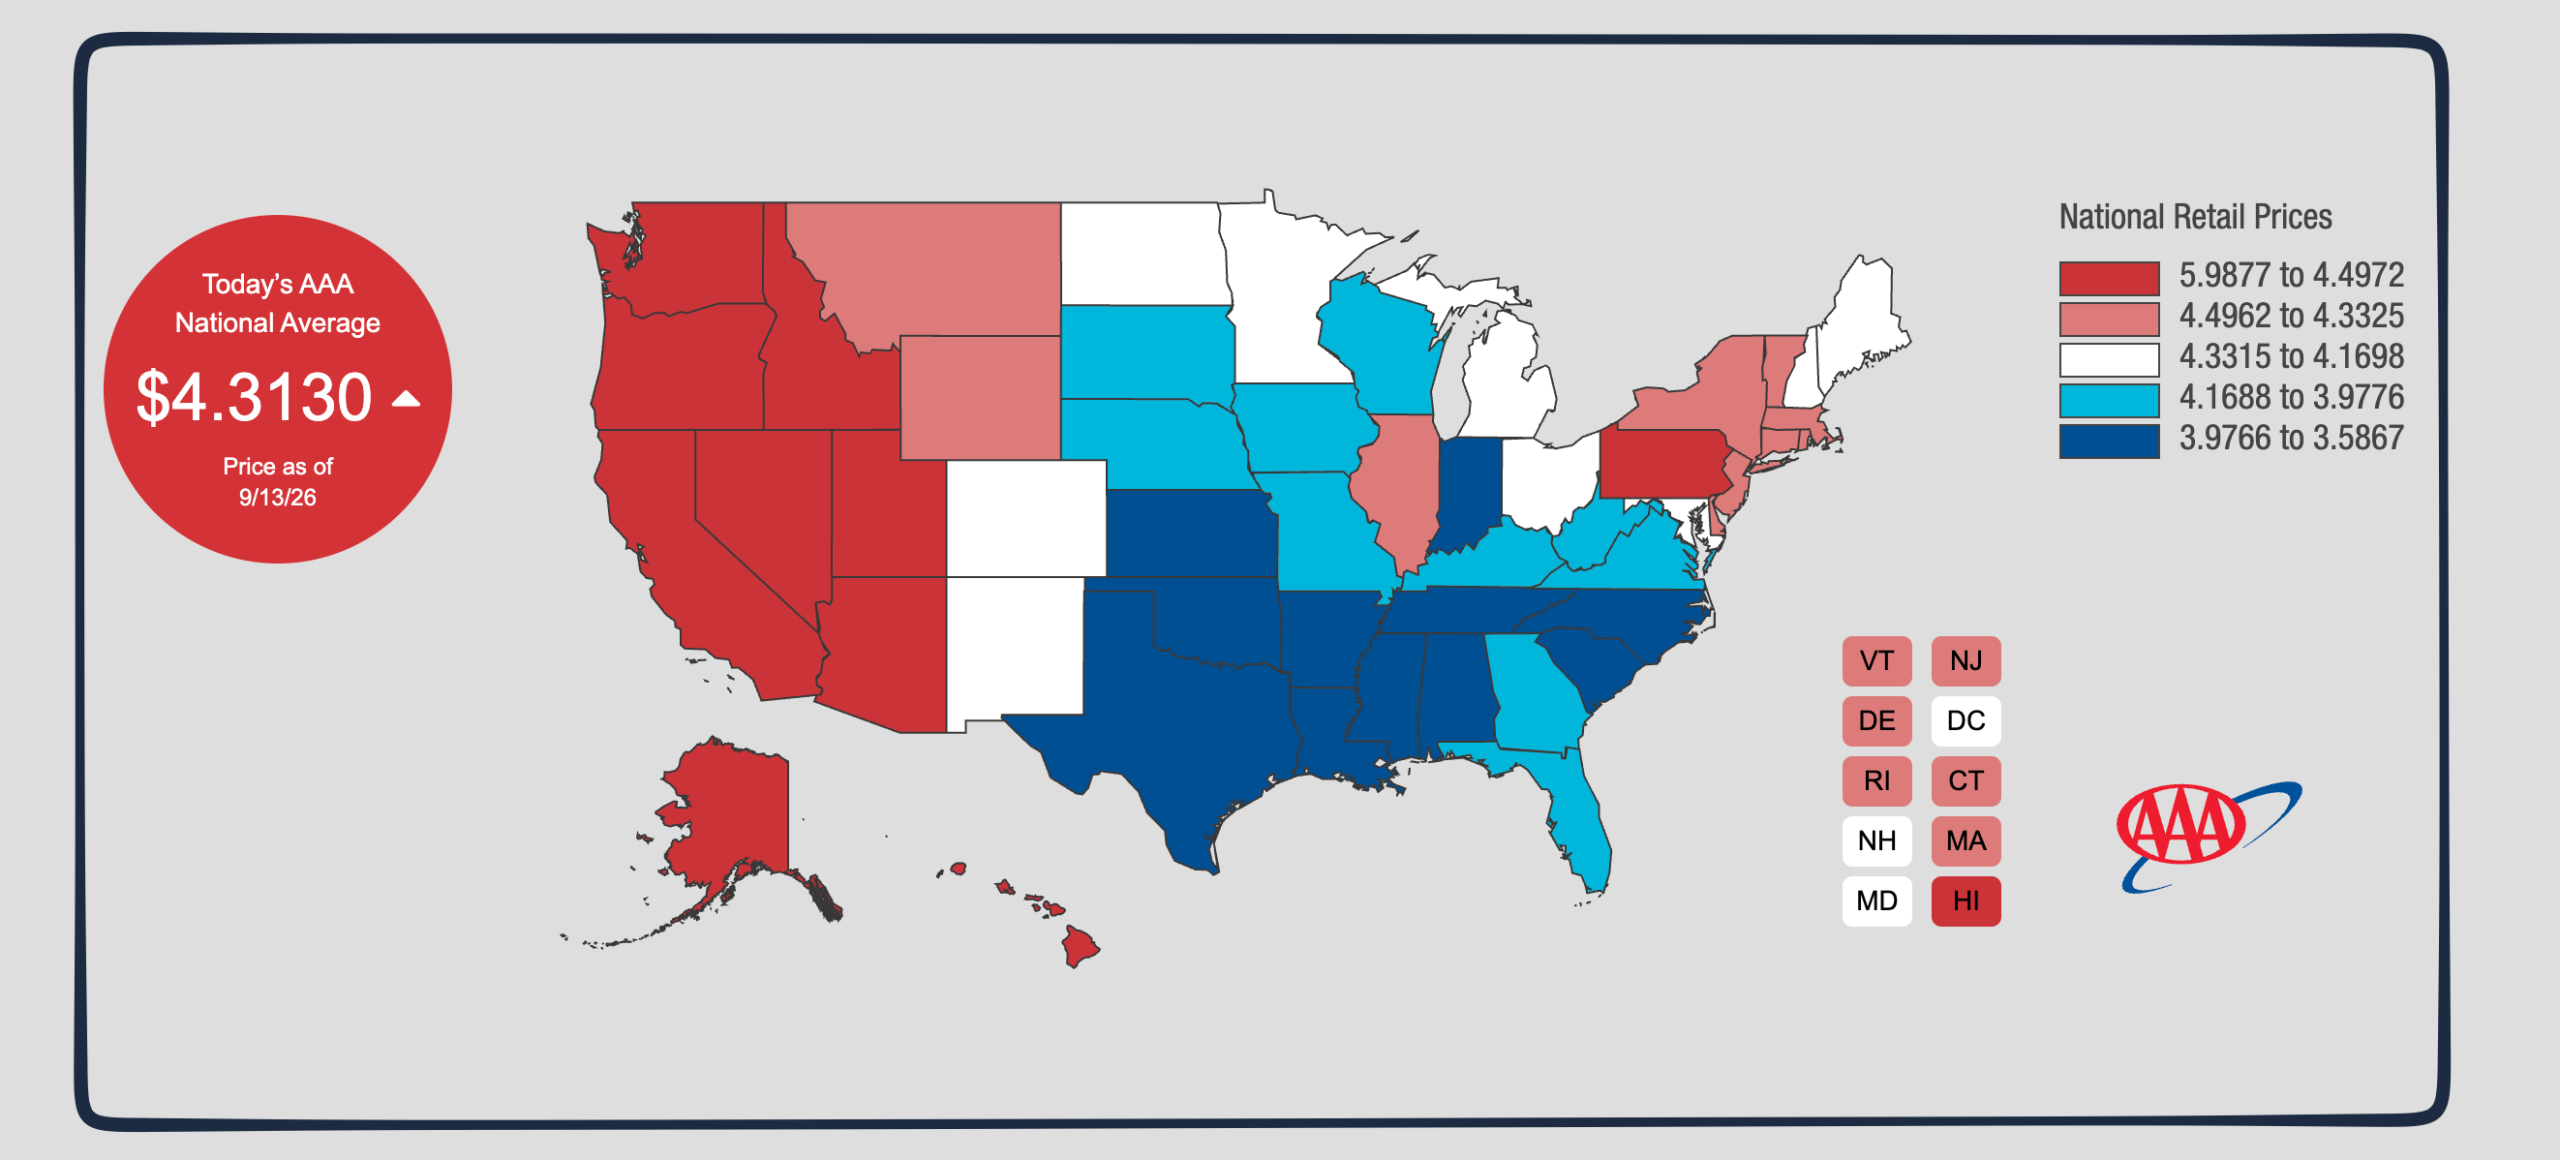
On February 27, the day before the Iran War began, the average price of gas was $2.98. Yesterday’s average gas price was $4.31 with a California high of $5.98.
Knowing we are more elastic than had previously been hypothesized, we can begin to predict the impact of the price hike.
Our elasticity reflects how much the quantity we demand responds to a price change. Thinking quantitatively, elasticity is a fraction comparing the percent change in quantity to the percent change in price. If quantity, as our numerator, is a bigger percent, then we are elastic. However, a larger denominator signifies inelasticity.
For gasoline, I’ve quoted from “High Frequency Evidence on the Demand for Gasoline.” As they explain, “While studies using aggregate data from the 1970’s and 80’s commonly reported gasoline demand elasticity estimates around −.25 to −.303, our aggregation results suggest that many of these estimates were also likely to have been biased and that actual demand response in earlier decades may have been substantially more elastic than previously thought.” As a result, the new study had elasticity numbers ranging from −.27 to −.35. (We should explain that the negative sign simply reflects that our numerator or denominator is negative. The key is the actual number that displays the magnitude.)
So, where are we? With gas prices soaring, we can expect that a slew of externalities will be created by our elastic response. At econlife, here, here, and here we’ve indicated some of them.
My sources and more: It was tough finding recent elasticity studies. We started with this Dallas Fed paper from 2020 and went back to a 2016 paper and this summary article. Then, for gas prices, I went to the always handy AAA website.