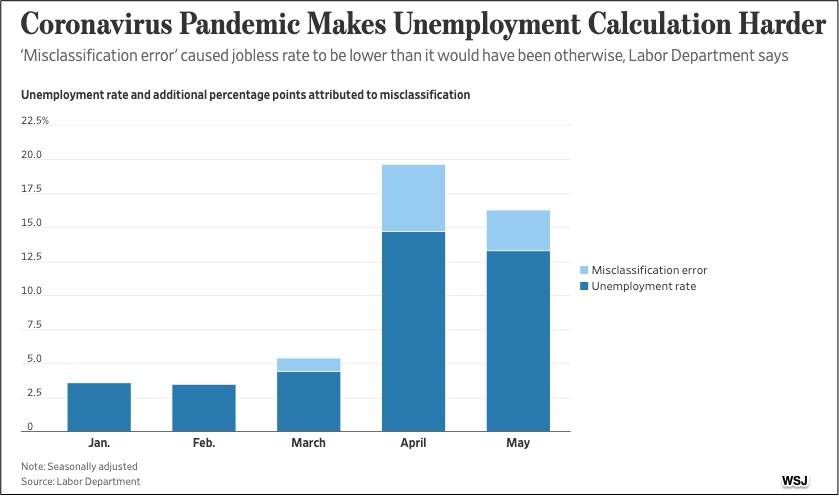
On May 8, the BLS (Bureau of Labor Statistics) press release said the U.S. unemployment rate was 14.7 percent. On June 5 they said it was 13.3 percent but added there was a “Misclassification Error.”
Where are we going? To the error and then why there is more to the unemployment numbers than a percent.
Real Unemployment Numbers
The Labor Force
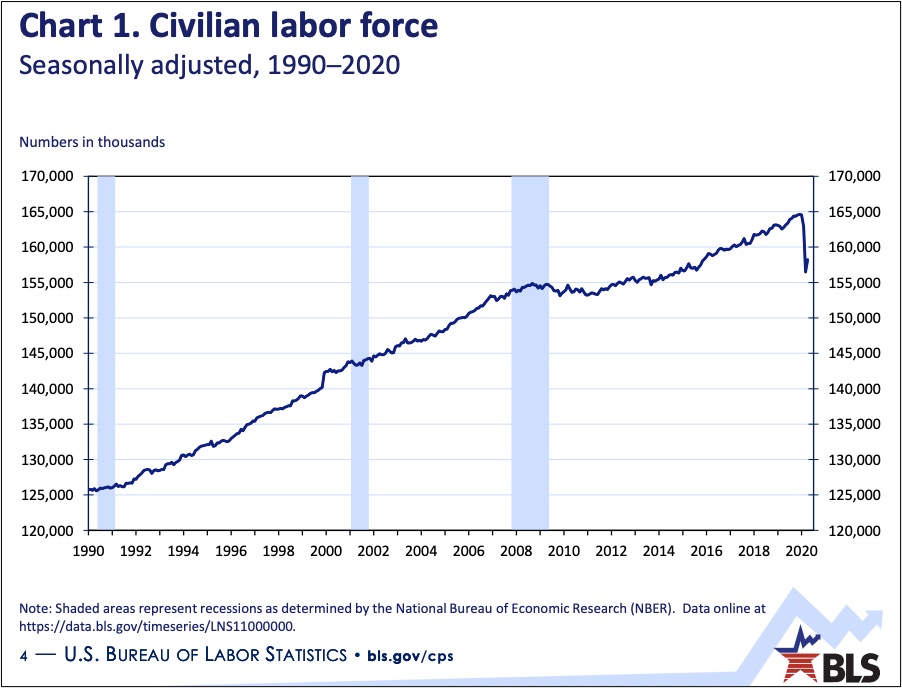
Whereas the U.S. population totals close to 328 million, there are approximately 155 million people in the labor force. You get counted as one of those 155 million people if you are 1) 16 or older and 2) working at a paid job or 3) not working elsewhere and looking for a job. From there, oversimplifying somewhat, we can say that the U.S. unemployment rate is just a fraction. You divide the people in the labor force who are looking for a job by the total number of people in the labor force and then multiply by 100 to create a percent. (Assume the labor force numbers 200 and 10 people without jobs are looking for work. Then 10/200 =.05 x 100 = 5%)
Even after recessionary dips, the size of the labor force has climbed. But now the plunge is bigger:
The Misclassification Error
The monthly jobs report states two headline numbers. It tells us 1) the unemployment rate and 2) the number of jobs that were created. To get their data, the BLS has a Household Survey and an Establishments Survey. From households they learn who is unemployed while the establishments (businesses) provide the job creation numbers.
Both surveys were affected by the coronavirus pandemic. But the Households Survey had the biggest hit. Millions of people are not at work because lockdowns have closed businesses (hopefully temporarily). The question is whether the people at home are…
- employed but absent.
- unemployed on temporary layoff.
Mistakenly, during March, April, and May, people said they were employed but absent when they were really unemployed on temporary layoff.
As a result, the reported May unemployment rate was 13.3% instead of 16.3%. For April, a 14.7% unemployment rate should have been 19.7%:
Whatever the percent, though, we can focus instead on a huge and unprecedented number. Close to 21 million people do not have jobs:
But there is more.
Our Bottom Line: U-6 and Participation Rates
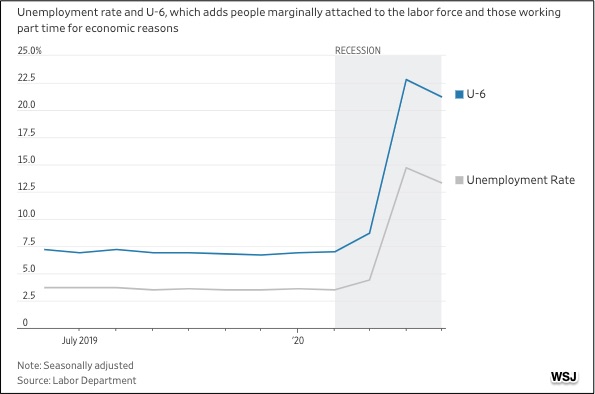
Not mentioned in the headlines, U-6 unemployment tells the real story.
The U-6 unemployment statistic adds to unemployment totals the people who work part time but want full time work and others who are no longer counted as a part of the labor force but looked for a job during the past year. Using those numbers, we wind up with 21.2 percent unemployment.
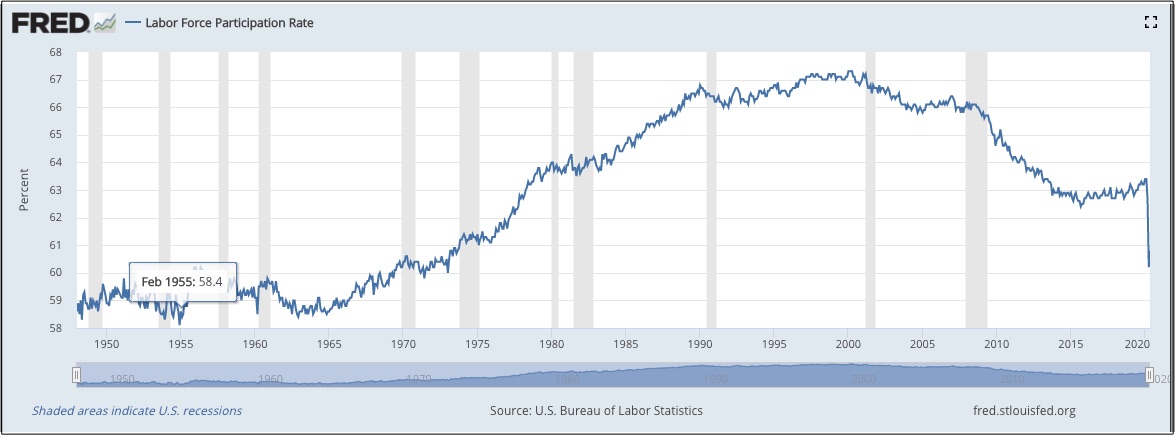
Next, we should look at the labor force participation rate. Comparing the number of people who could be in the labor force to those who are in it, the current participation rate shows us who has dropped out. The difference between February and May is the six million people who are neither working nor looking for a job:
Even in a normal world, calculating an unemployment rate is tough. You have to define unemployment and be sure to ask clear questions. Add the pandemic to all of that and you have a gargantuan task. For you and me, that means a closer look at other numbers in the report to know truly what is happening.
My sources and more: After reading James Hamilton’s blog, I needed other sources to complement his commentary. It was worth the wait. Soon after,The Washington Post and WSJ had ideal articles. You can also read the actual misclassification note at the end of the employment press release.
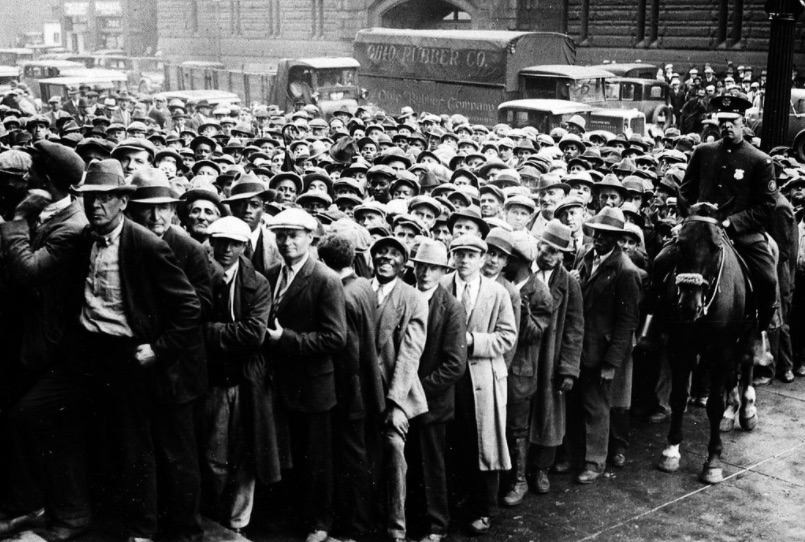
Our featured image, from the Associated Press via The Boston Globe shows a group of people outside Cleveland’s City Hall waiting to apply for jobs during the Great Depression. In 1933, the unemployment rate was estimated at a touch below 25 percent.



Very interesting, good explanation of a complicated concept.