What Female Soccer Players Hope to Win in Court
June 12, 2019
The One Investment That Is (Probably) a Sure Thing
June 14, 2019#TBT: Today’s Google is the result of 270 acquisitions. Let’s look back at what it (and others like it) used to be and then forward to what we have now.
Google’s Growth Spurts
During the past 23 years, Google was first BackRub (very briefly), then Google (for close to 16 years), and now Alphabet. At first it was a unique search engine developed by two Stanford graduate students, Sergey Brin and Larry Page. Created in 1999, AdWords was an early idea that generated some of their first revenue. Five years later, slightly more than 19.6 million shares were sold publicly for $85 apiece through an IPO (Initial Public Offering).
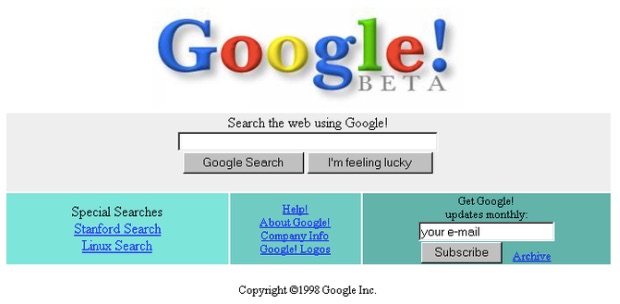
An early homepage:
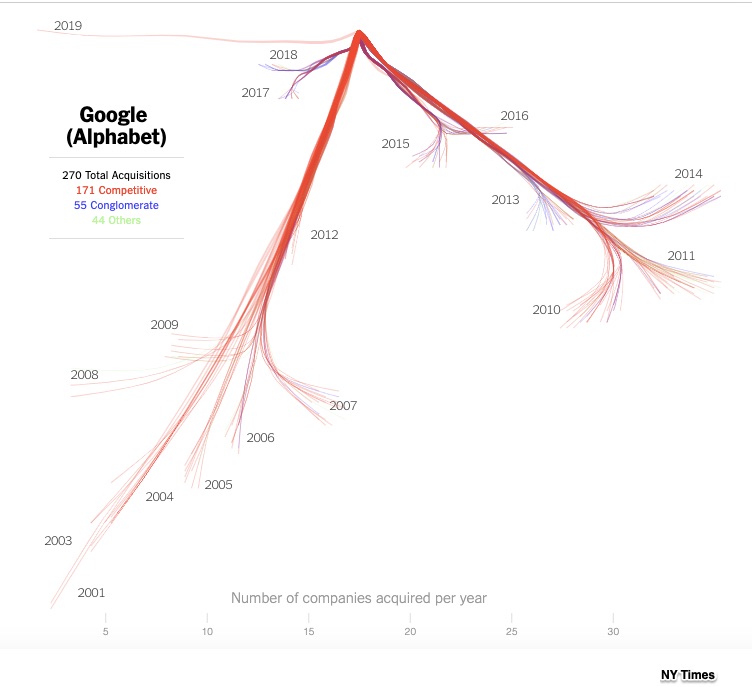
Since then, they’ve acquired 270 companies. Close to 63% of that total was for potential (and actual) competitors that included companies like Doubleclick (ads), YouTube (you know) and Waze (maps). Meanwhile 20% involved expanding into new areas like AI and robotics. The remainder is varied.
This NY Times graphic shows all of Google’s growth spurts. 2011 and 2014 were the most active acquisition years:
A Superstar Trend
As we look back to when Google was simply for search and now at its multiple identities, we see a trend in which fewer firms have more market power. Like Google, companies are getting larger. Goldman Sachs calls it the emergence of the superstars. According to Goldman Sachs research, the number of firms that trade in stock markets is down while their size is up. In 1996 there were 8000 listed firms; now there are closer to 4,000.
Our Bottom Line: Concentration
When economists talk about market power, they use the word concentration. In concentrated markets, there are fewer firms, they are large, they dominate sales, and they have some price making power. To quantify concentration, we can use a Herfindahl-Hirschman Index (HHI). The higher the HHI number, the greater the concentration. The Index can be based on different scales but typically the closer to 10,000, the greater the concentration.
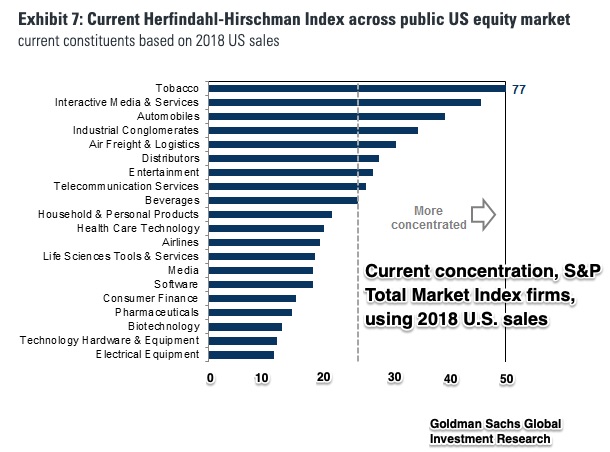
Below you can see concentration from 20 industry groups for firms that are listed in the S&P. Tobacco is at the top while Interactive Media and Services are a close second:
If 10,000 is at the top of the the Herfindahl-Hirschman Index, then 10,000 equals a monopoly. To calculate the Herfindahl-Hirschman index number, we can square the market share of each firm and then add them together. So, if a company is the only competitor, then its sales are 100% of the industry. The square of 100 is 10,000. However, if you have 100 firms, each with 1% of the shipments in an industry (or the sales, or for banks, perhaps the deposits), the HHI is 100:
12 + 12 + 12 + 12 + 96 other 12 = 100
When the U.S. Department of Justice uses the HHI to evaluate a merger proposal, it considers less than 1500 competitive, 1500-2500 moderately concentrated, and more than 2500, highly concentrated. Thinking of Alphabet (and Facebook), you can see why “interactive Media and Services is so concentrated.
My sources and more: The NY Times column on concentration and a (gated) Goldman Sachs report created the perfect synergy. As a final step, you might want to learn more about the HHI in an article from the St. Louis Fed and from the Department of Justice guidelines.
![econlifelogotrademarkedwebsitelogo[1]](/wp-content/uploads/2024/05/econlifelogotrademarkedwebsitelogo1.png#100878)

