
Weekly Roundup: From Robot Servers to Shrimp Farmers
August 1, 2015
The Reason We Should Drive Around in Circles
August 3, 2015Throughout a life cycle, the impact of inadequate sanitation grows. Because of disease, stunting and undernutrition, children’s cognitive development is diminished. Continuing through adulthood, the costs include the time and dollars spent on health care treatment, lost productivity and premature death.
Where are we going? To the sanitation gap among and in countries.
Sanitation Topics
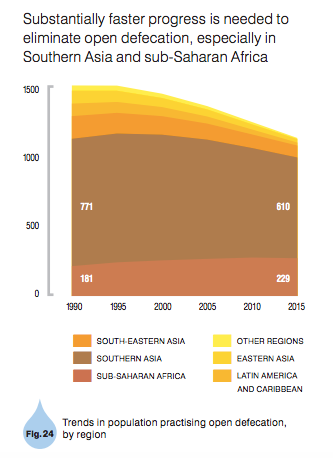
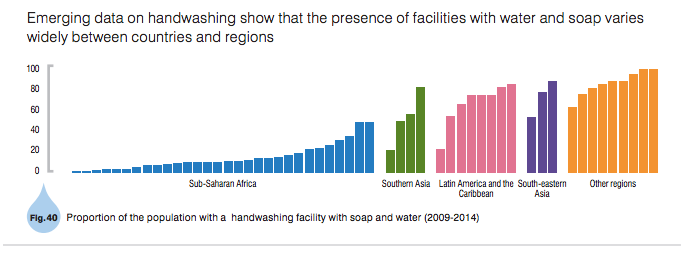
First we should decide what we mean by sanitation. In a recent Unicef/WHO paper on how much the world’s sanitation and drinking water have improved, eliminating open defecation was a primary focus while hand washing was also a thread.
Defecation
Hand Washing
Sanitation Inequality
Geography
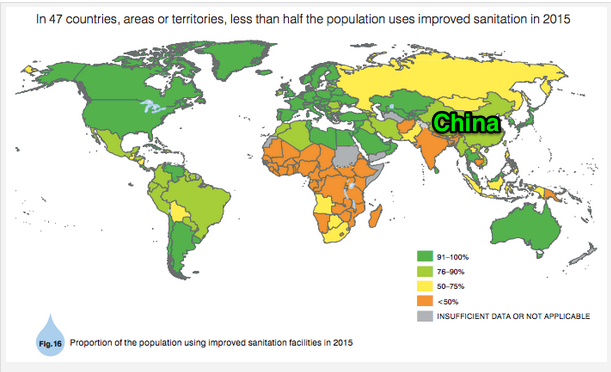
Below you can identify the countries with Inadequate sanitation. I’ve labeled China because it has been cited for its progress.
Populations
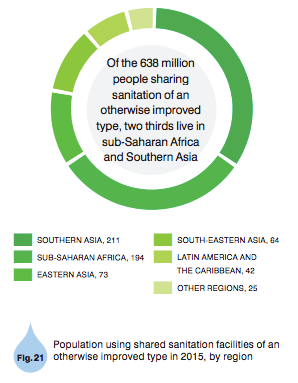
Moving to a slightly different geographic perspective, we can look at improved sanitation facilities that are shared by more than one household.
Rural/Urban Comparison
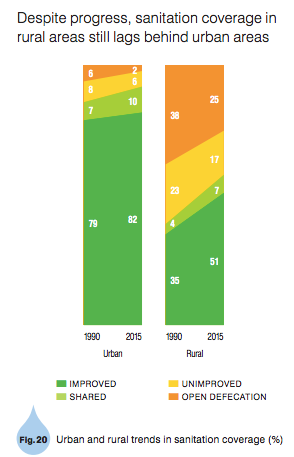
In addition to regional differences, there is a rural/urban gap in sanitation quality in certain parts of the world:
Urban Areas
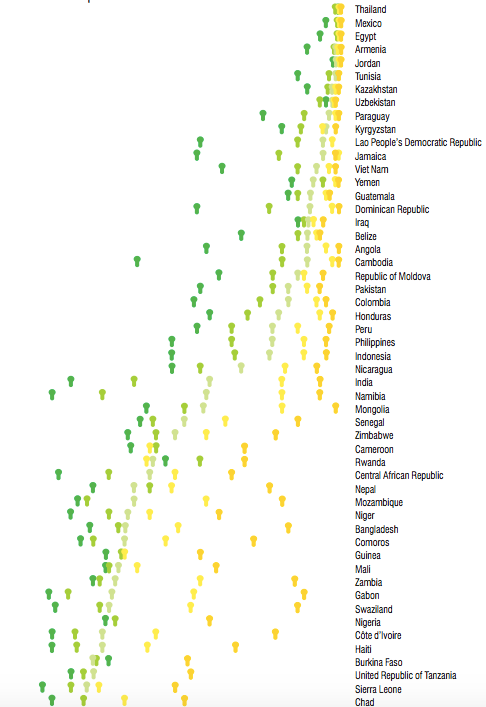
Looking more closely at urban areas, we also can identify sanitation inequality.
Below, the countries’ order is based on urban sanitation for the middle wealth quintile. The dots, by contrast, indicate the gaps between different wealth quintiles. When the gap is widest between the bottom and the next quintile, the condition is called “bottom inequality.” The opposite, “top inequality” shows a wide gap between the top quintile and those beneath it.

The Future
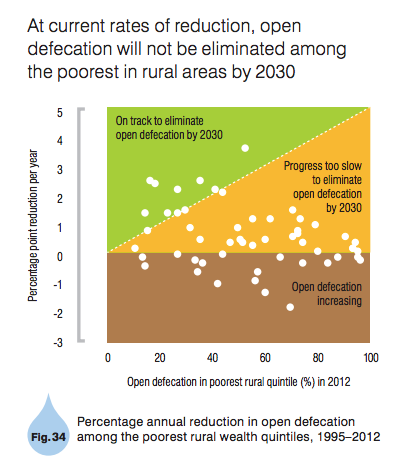
Finally, looking at the future (below), you can see that improving sanitation remains a big challenge:
Our Bottom Line: Production Possibilities Graphs
Debilitating human capital, the lack of sanitation chips away at economic growth and GDP’s major components. Consumer spending power is diminished, businesses cope with a less productive work force and a disproportionate amount of government spending is directed toward a distressed population.
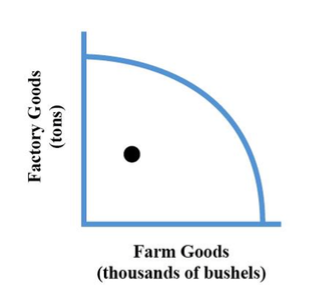
A production possibilities graph can convey the underutilization that inadequate sanitation creates. Below, every point on the curve shows the max the economy can produce with its land, labor and capital. Representing specific output, the dot shows the underutilization. Because underutilization varies, that dot takes us back to the sanitation gap.
![econlifelogotrademarkedwebsitelogo[1]](/wp-content/uploads/2024/05/econlifelogotrademarkedwebsitelogo1.png#100878)


