![econlifelogotrademarkedwebsitelogo[1]](/wp-content/uploads/2024/05/econlifelogotrademarkedwebsitelogo1.png#100878)


Our Weekly Economic News Roundup: From Springsteen Tickets to Rwanda’s Trucks
August 20, 2022
Economic Inequality…or Equality?
August 22, 2022
Knowing that tomorrow is National Tooth Fairy Day, the Tooth Fairy could be smiling…but not for long.
Like most childcare costs, the Tooth Fairy’s expenses have been rising recently.
Cost of Children
Tooth Fairy
If the Tooth Fairy visited your house during 2022, she probably left close to $5.36 per tooth. Higher than in 2021 ($4.70), that $5.36 price was a large leap from 2020 ($4.03).
Also, it cost the tooth fairy much less in the West:

Raising a Child
The tooth fairy is a very tiny slice of the $310,605 that we spend to raise a child born in 2015 through age 17.
With housing the largest, the expenditure categories are what we would expect:
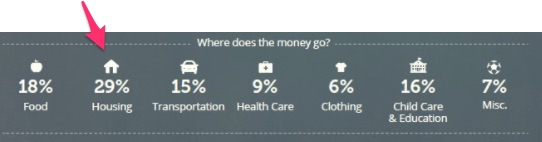
However, it is not quite that simple.
It all depends on what you buy. WSJ has a massive infographic from which I selected 10 examples of price changes during the past 12 months (as of July,2022):
- All items: +8.52%
- Housing +7.32%
- Food +10.93
- Apparel +5.13%
- Sports equipment +5.97%
- Boys and Girls Footwear +7.71%
- Lettuce +8.62%
- Video & Audio Products -6.59%
- Computers -3.53%
- Physicians’ +.83% services
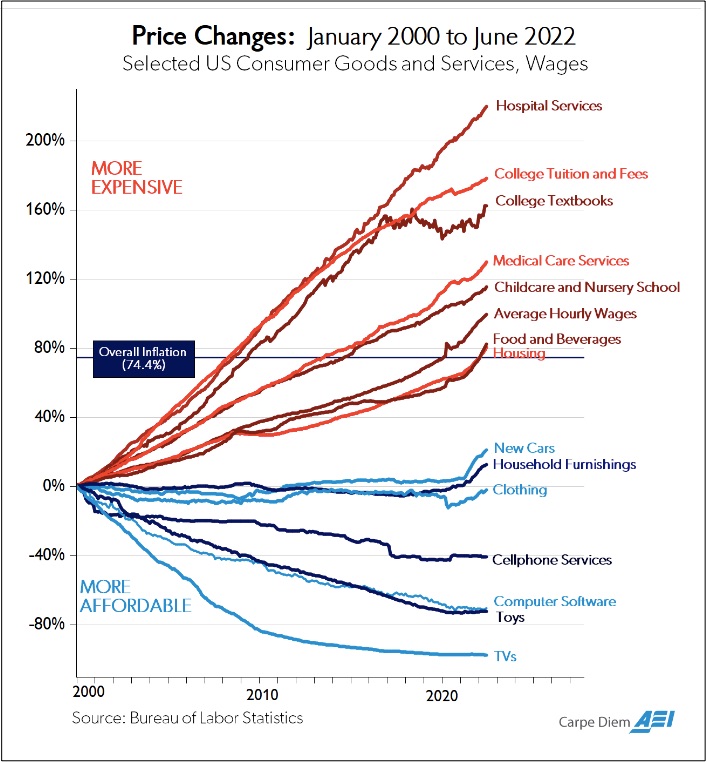
The Big Picture
But economist Mark Perry always gives us the best summary every six months:
Our Bottom Line: Economies of Scale
Perhaps though the cost of children is really about economies of scale. Or, we could say that they are “cheaper by the dozen” when they share a bedroom, pass down clothing and consume cases from Costco.
In a 2017 report, the USDA told us that a married-couple spends close to 27% more on a single child than a family with two children. Meanwhile, compared to that family with two children, having three or more lets you save a whopping 24% on each child.
But not really.
When you think about the intangible cost of time, stress and sacrificed opportunities, those economies of scale shrink.
My sources and more: While my tooth fairy totals were from Delta Dental, I suggest looking at this WSJ article for the whole picture. They are voluminous. But the best study was here on the cost of the stress kids create. And finally, a bit dated, the USDA had the basic report.
Please note that some of today’s post is an update from 2017. Also, I have assumed that spending proportions from the USDA 2017 report have not changed because of inflation.

