A New Product That Pays For College
March 31, 2019
The Hidden Incentives That Determine Our Big Decisions
April 2, 2019November 1 has been called Finland’s “National Jealousy Day.”
Annually, on November 1, Finland does a tax data dump. You just need to visit the tax records office to find out what your neighbors earn. The visit, though, could ruin your day.
Where are we going? To see if happiness is relative.
Norway’s Income Transparency
For income transparency, Norway is the place to start. From 2001 to 2013, Norway made it unusually easy to get everyone’s tax data online. The data was also accessible through apps that mapped wealth geographically or by Facebook friends. In 2008, there were 29.4 million searches. However, in 2014, search inquiries plunged by 88% when website users had to provide their names.
Researchers have suggested that the website made it easy for people to “snoop.” A majority of a survey’s participants (61%) said they looked for close relatives. Next, people checked on themselves and then friends. Surprisingly, many were not as curious about their colleagues at work.
Meanwhile, the data suggested that more income transparency widened the well-being gap between the rich and the poor. When we hear about earning more than others, our self-esteem increases; learning we have relatively less corresponds to lower perceived well-being. One reason could be that people who knew you were relatively richer treated you better. It also might have had some psychological utility.
A Bank’s Income Transparency
Somewhat similarly, the Harvard Business Review tells about an experiment at a large Asian bank. When they asked employees to guess what their peers earned, most guessed incorrectly. Those who learned their associates actually earned more than they thought diminished their work hours, emails, and sales volume.
A University’s Income Transparency
Again, through a third study (2008), we can see the impact of negative comparisons. Here, salaries at the University of California became public after a right to know law was passed. Before most employees knew they could access their peers’ earnings, researchers told a random sample and then compared their response to a control group. Sort of like Norway and the large bank, people who learned they earned less than the median displayed dissatisfaction. Some reported lower job satisfaction and others quit.
Our Bottom Line: Regional Income Inequality
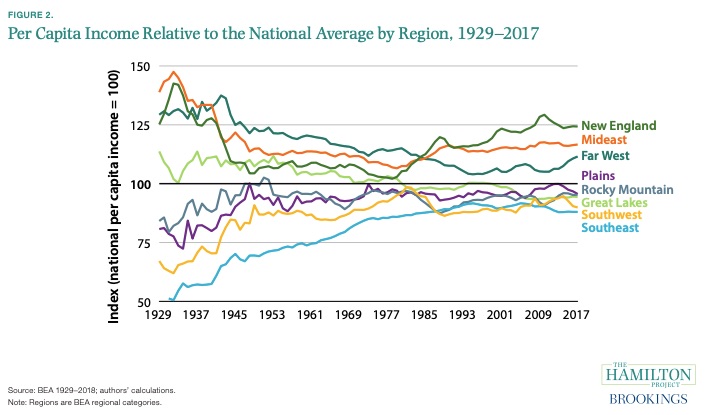
From self-perceived individual inequality, let’s take a leap to regional inequality In their study of economic geography, the Brookings Institute compared income and “vitality” among different U.S. regions.
Your can see how the “100” horizontal line divides the U.S.:
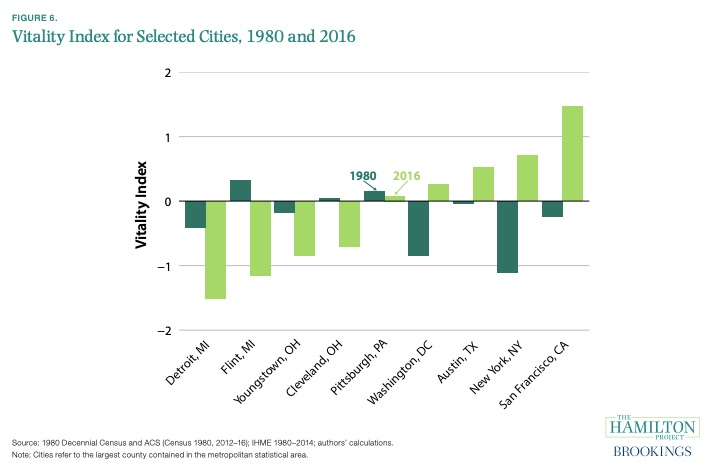
Brookings also has a “Vitality” index that quantifies economic and social well being. The index’s variables include median household income, the poverty rate, the unemployment rate, and the housing vacancy rate.
Below, Brooking compares nine cities:
Where are we? Perhaps like the impact of Norway’s income transparency, we can look at U.S. regional income differences through a lens of relative inequality.
My sources and more: First this Ricardo Perez-Truglia paper and then this NY Times article on Finland presented the facts on income transparency. They led me to salary disclosure experiments at the University of California and a large Asian bank. Perhaps taking too large a leap but one that is thought-provoking, I wound up with this economic geography report from Brookings
![econlifelogotrademarkedwebsitelogo[1]](/wp-content/uploads/2024/05/econlifelogotrademarkedwebsitelogo1.png#100878)


