A Labor Day Look at How Much We Work
September 3, 2018
What Does the World Owe?
September 5, 2018Like me, you’ve probably never heard of Eastern Filbert Blight. However, the future supply of Nutella could depend on curing it.
The Hazelnut Supply
Nutella is 13% hazelnuts–50 to 55 in each 13-ounce jar. Although its producer denies the decline, rumors have it that the hazelnut content had been 17% until a 2013 frost in Turkey reduced the crop. With Turkey growing 75% of the world’s hazelnuts, the price shot up and nut content (maybe) went down.
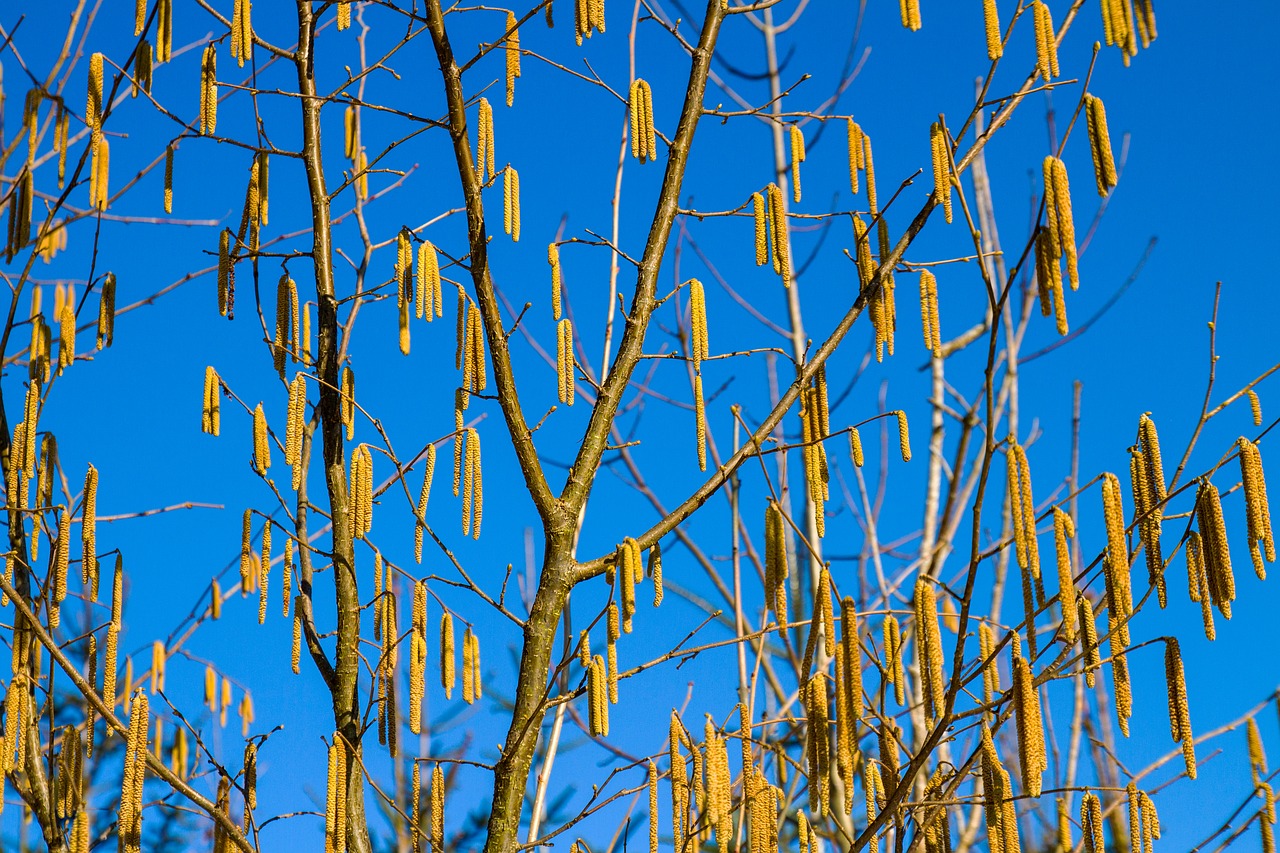
A hazelnut tree:
And that takes us to Rutgers University in New Jersey.
A team at Rutgers recently announced that after 20 years of research, they had developed a hazelnut tree that could grow in the Northeastern U.S. and Canada. Using seeds from Eastern Europe, the Rutgers group experimented with thousands of trees until they had a hardy hybrid that resisted Eastern Filbert Blight (a devastating Northeastern U.S fungus) and cold weather. If it all works out Ferrero (Nutella’s maker) will be able to diversify its supply.
So, for now, we seem to have enough hazelnuts. But as demand grows, we will need more.
Our Bottom Line: Comparative Advantage
A 2012 OECD (Organization for Economic Cooperation and Development) report on “global value chains,” tells us that the comparative advantage of the locations determines where a product moves from “conception to final use by the consumer.” All they mean is that technology and/or resources can determine where it’s most efficient to make something. As economists we would say that the optimal location has the comparative advantage.
Looking at 2012 global Nutella supply chain, you can justify the spread with comparative advantage:
 And soon (rather amazingly) we could add New Jersey hazelnuts to the map.
My sources and more: My interest in hazelnuts started with a NY Times Daily podcast on Turkey’s economy. Naturally though, reading about hazelnuts then took me straight to Nutella, this National Geographic article, and a Quartz description of the 2013 frost. It also reminded me of the 2012 OECD report. You might want to look at the supply chains in the report to see what might be upset by new trade policies.
![econlifelogotrademarkedwebsitelogo[1]](/wp-content/uploads/2024/05/econlifelogotrademarkedwebsitelogo1.png#100878)


