The 5 Stars That People Get (And Don’t Deserve)
April 9, 2018
Does Rent Control Really Control Rent?
April 11, 2018The Congressional Budget Office was late this year.
Usually, their outlook on the budget and the economy comes out during January. This year too much was happening. In December, there were the new tax acts, in February a two-year budget deal, and after that, more spending bills.
Hoping for some accuracy, the CBO waited until yesterday to publish “The Budget and Economic Outlook 2018-2028.”
Let’s see why it takes us to a tough decision.
A Deficit and Debt Summary
Sort of like comparing a family’s income to the mortgage on its home, we can also judge the size of our debt.
Assume for a moment that you are Bill Gates. As one of the founders of Microsoft, you would consider a two million dollar mortgage an easily manageable pittance. However, if you are more average, that mortgage is massive.
We could say that that the United States is like Bill Gates. It can afford a huge debt because it has a lot of income and wealth. But there are limits. And according to the CBO, we could be pulling closer to those constraints.
The CBO Report
Our Wealth
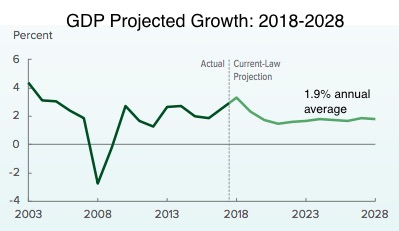
Let’s use the GDP–the dollar value of the goods and services we produce each year– as the yardstick of our wealth. In the CBO report, real GDP is projected to grow an average of 1.9% annually from 2018-2028. Looking to 4th quarter of 2018 we are at 3.3%. However, growth then slows to 1.7% by 2028:
Our Deficit
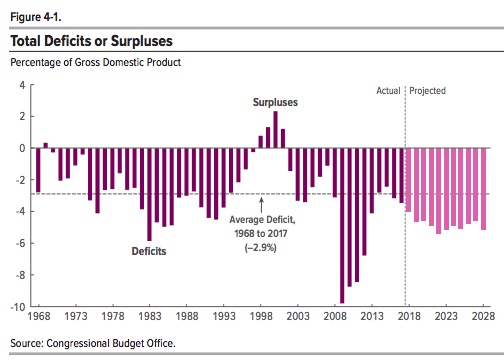
The deficit is the amount during one year that federal expenditures exceed federal revenue. Currently the deficit is 4% of GDP. Projecting, the CBO expects it to rise to 5.4% of GDP in 2022 and then to recede slightly back to 5.1% in 2028.
Represented by the dashed line, the average deficit (2.9% of GDP) for the past 50 years will be exceeded consistently during the next decade:
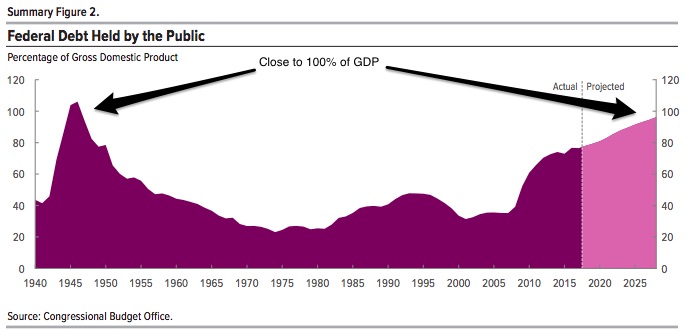
The debt is the total amount that the federal government owes. It is approximately all we’ve borrowed to cover years of deficits minus what has been paid back. Currently the total debt held by the public (the U.S. government owns some of its own debt too) is 78% of GDP. The 2028 projection is a whopping 96.25% of GDP,
You can see that the last time the debt was close to 100% of GDP was during WWII. I’ve added the arrows:
Our Bottom Line: What You Need to Decide
In yesterday’s Washington Post, a group of eminent economists including Janet Yellen expressed their disagreement with another auspicious group from the Hoover Institution. Supporting large cuts in spending, the Hoover group says entitlements are the primary spending problem. Meanwhile, the Yellen group says, “Start with spending goals based on the priorities of the American people and then set tax policy to realize adequate revenue. The Hoover economists’ advocacy of paying for large tax cuts with entitlement reductions would take the United States in the wrong direction.”
Do you agree with the Yellen group or the Hoover Institution’s economists?
These are the facts. You decide:
My sources and more: While my primary source was the CBO report, WSJ had a good summary. However, to get the real debate (and dilemmas), do read these Washington Post Opinion columns from the Yellen Group and the Hoover group. They take us straight into opportunity cost territory.
All infographics are from the CBO.
![econlifelogotrademarkedwebsitelogo[1]](/wp-content/uploads/2024/05/econlifelogotrademarkedwebsitelogo1.png#100878)

