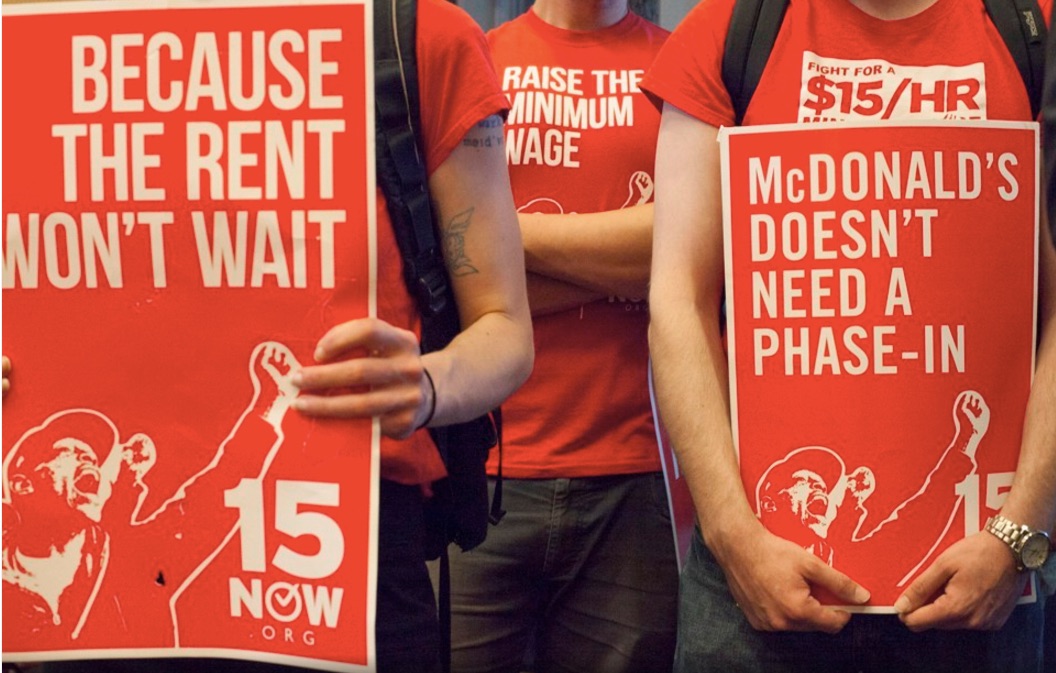
With the minimum wage, no one-size-fits-all.
From state to state, the minimum wage varies. Although the federal minimum wage is $7.25, the minimum for workers who get tips is $2.13. In addition, 40 municipalities have a higher minimum wage than their state’s minimum. And those states without a minimum wage use the federal amount:
When you mention the minimum wage, economic opinion pretty much divides between two camps. One group says a minimum wage hike has little impact on jobs while the other says the opposite.
And now, one side has gotten some extra “ammunition.”
The Seattle Minimum Wage Study
In 2014, Seattle’s Minimum Wage Ordinance established a schedule for the minimum wage to rise. Climbing to $11 in 2015 and then $13 in 2016, the top will be $15. But the debate over its impact has begun.
The Debate
Forever (it seems that way), economists have been debating the impact of a minimum wage hike.
Scholars who want to prove that a higher minimum wage can have no impact on low wage jobs cite a 1992 study. According to their data, a New Jersey 80 cent minimum wage increase to $5.05 was primarily beneficial. Surveying 410 fast-food establishments like Wendy’s and Burger King, they found that employment was stable and non-wage benefits were unaffected or even improved. As for prices, yes, they did rise but only by 3% with little impact.
Now, telling us they have access to more precise data, economists from the University of Washington disagree. They say the difference is that studies like the one from NJ used industry facts. The scholars looking at Seattle’s minimum wage hike were able to access individuals’ wages from government records.
Their conclusions? Lower wage workers were losing jobs.
The average pay was up for low wage workers but there were fewer jobs and shorter hours for those who kept their jobs. Specifically, hours for low-skilled workers were down by 9.4% when the minimum wage rose to $13. At the same time, there were 5,000 fewer low wage jobs, a 6.8% drop.
Our Bottom Line: Price floors
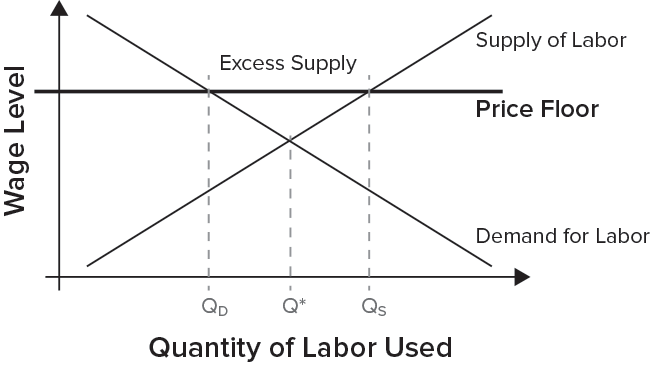
The University Of Washington study returns us to a traditional price floor. On a supply and demand graph, floors prevent price (wage) from moving down to equilibrium where it naturally gravitates because quantity demanded equals quantity supplied.
Below, you can see the horizontal line that represents a floor. Because the quantity supplied of workers at that wage (QS) exceeds the quantity demanded (QD) for them, a floor is supposed to create unemployment:

Where does all of this lead us? To an economic debate that has re-ignited.
My sources and more: I’ve added Vox’s “The Weeds” to my morning walks podcast roster. Their lively discussion of the minimum wage is the source of today’s post. I thank them for alerting me to the University of Washington study and stimulating a search that took me to some interesting analysis at fivethirtyeight. Finally, for minimum wage data, the EPI is a handy source.
Please note that several sentences from today were in a previous econlife post and our featured image was from the Atlantic.


