![econlifelogotrademarkedwebsitelogo[1]](/wp-content/uploads/2024/05/econlifelogotrademarkedwebsitelogo1.png#100878)


When To Buy a Movie and Not Rent One
August 27, 2026
August 2026 Friday’s e-links: Learning More About Asian and African Economic Development
August 28, 2026
Comparing wages, we usually express a dollar amount. However, there is a better alternative.
We can use hamburgers and coffee.
Comparing Wages
McDonald’s Big Macs
As a common denominator, the Big Mac comes in handy. Because they tend to be made with similar human capital, we can compare McDonald’s wages.
For the following graphic, McDonald’s just had to calculate the number of Big Macs a worker’s wage will buy annually. Then, they also looked at what an hourly wage would buy:
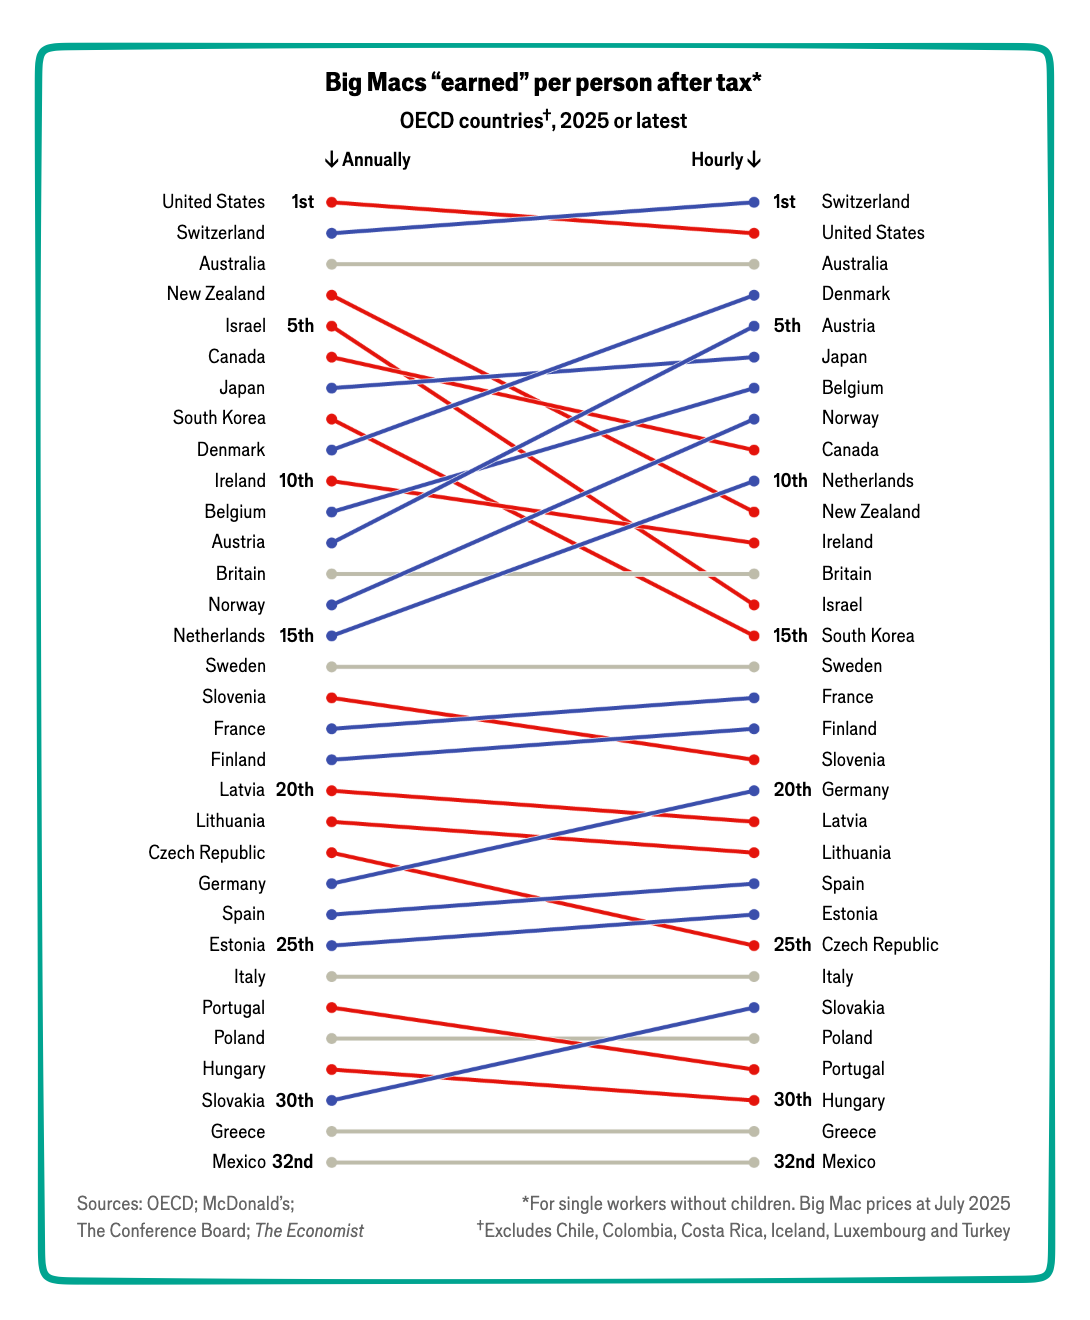
Plunging from 13,601 in 2024 to 10,215 last year, the U.S. still remained #1 for the number of burgers its annual and wage could. However, when we look at hourly earnings, the United States drops to #2 with Switzerland in the top spot.
Starbucks Tall Lattes
We can also gauge a wage with a Starbucks tall latte:
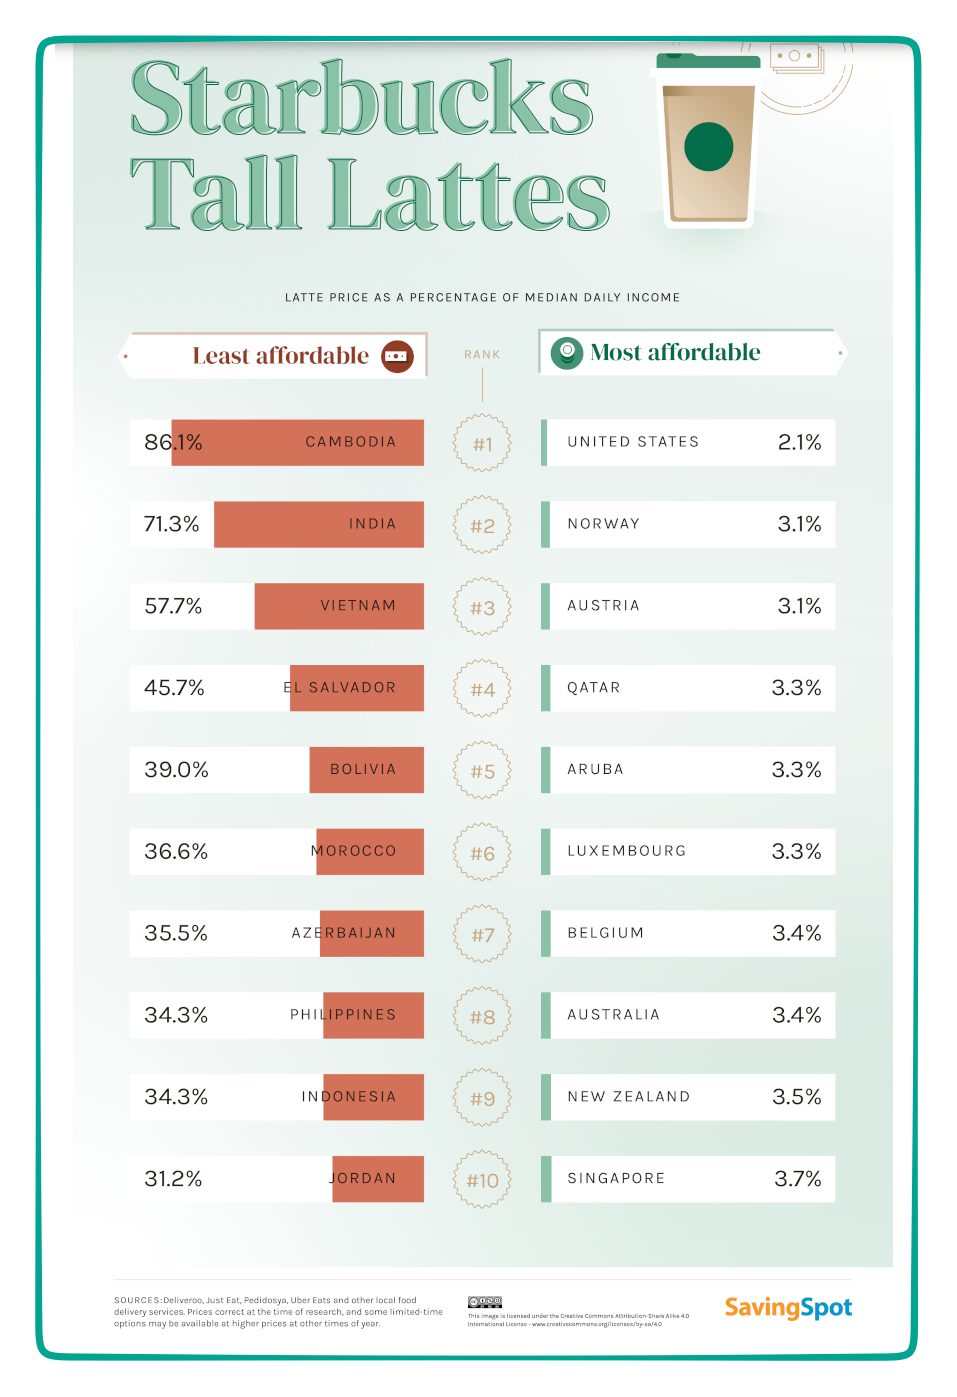
Then also, the United States is at the top. The U.S. workers that earn the median daily income spend 2.1% of their earnings on a Starbucks tall latte, while for Norway, it’s 3.1%. However, even as high earners, coffee drinkers in Switzerland, Denmark and Luxembourg pay a hefty amount for their tall latte. Meanwhile, in Cambodia and India, workers need more than 70% of their median daily wage to buy a tall latte.
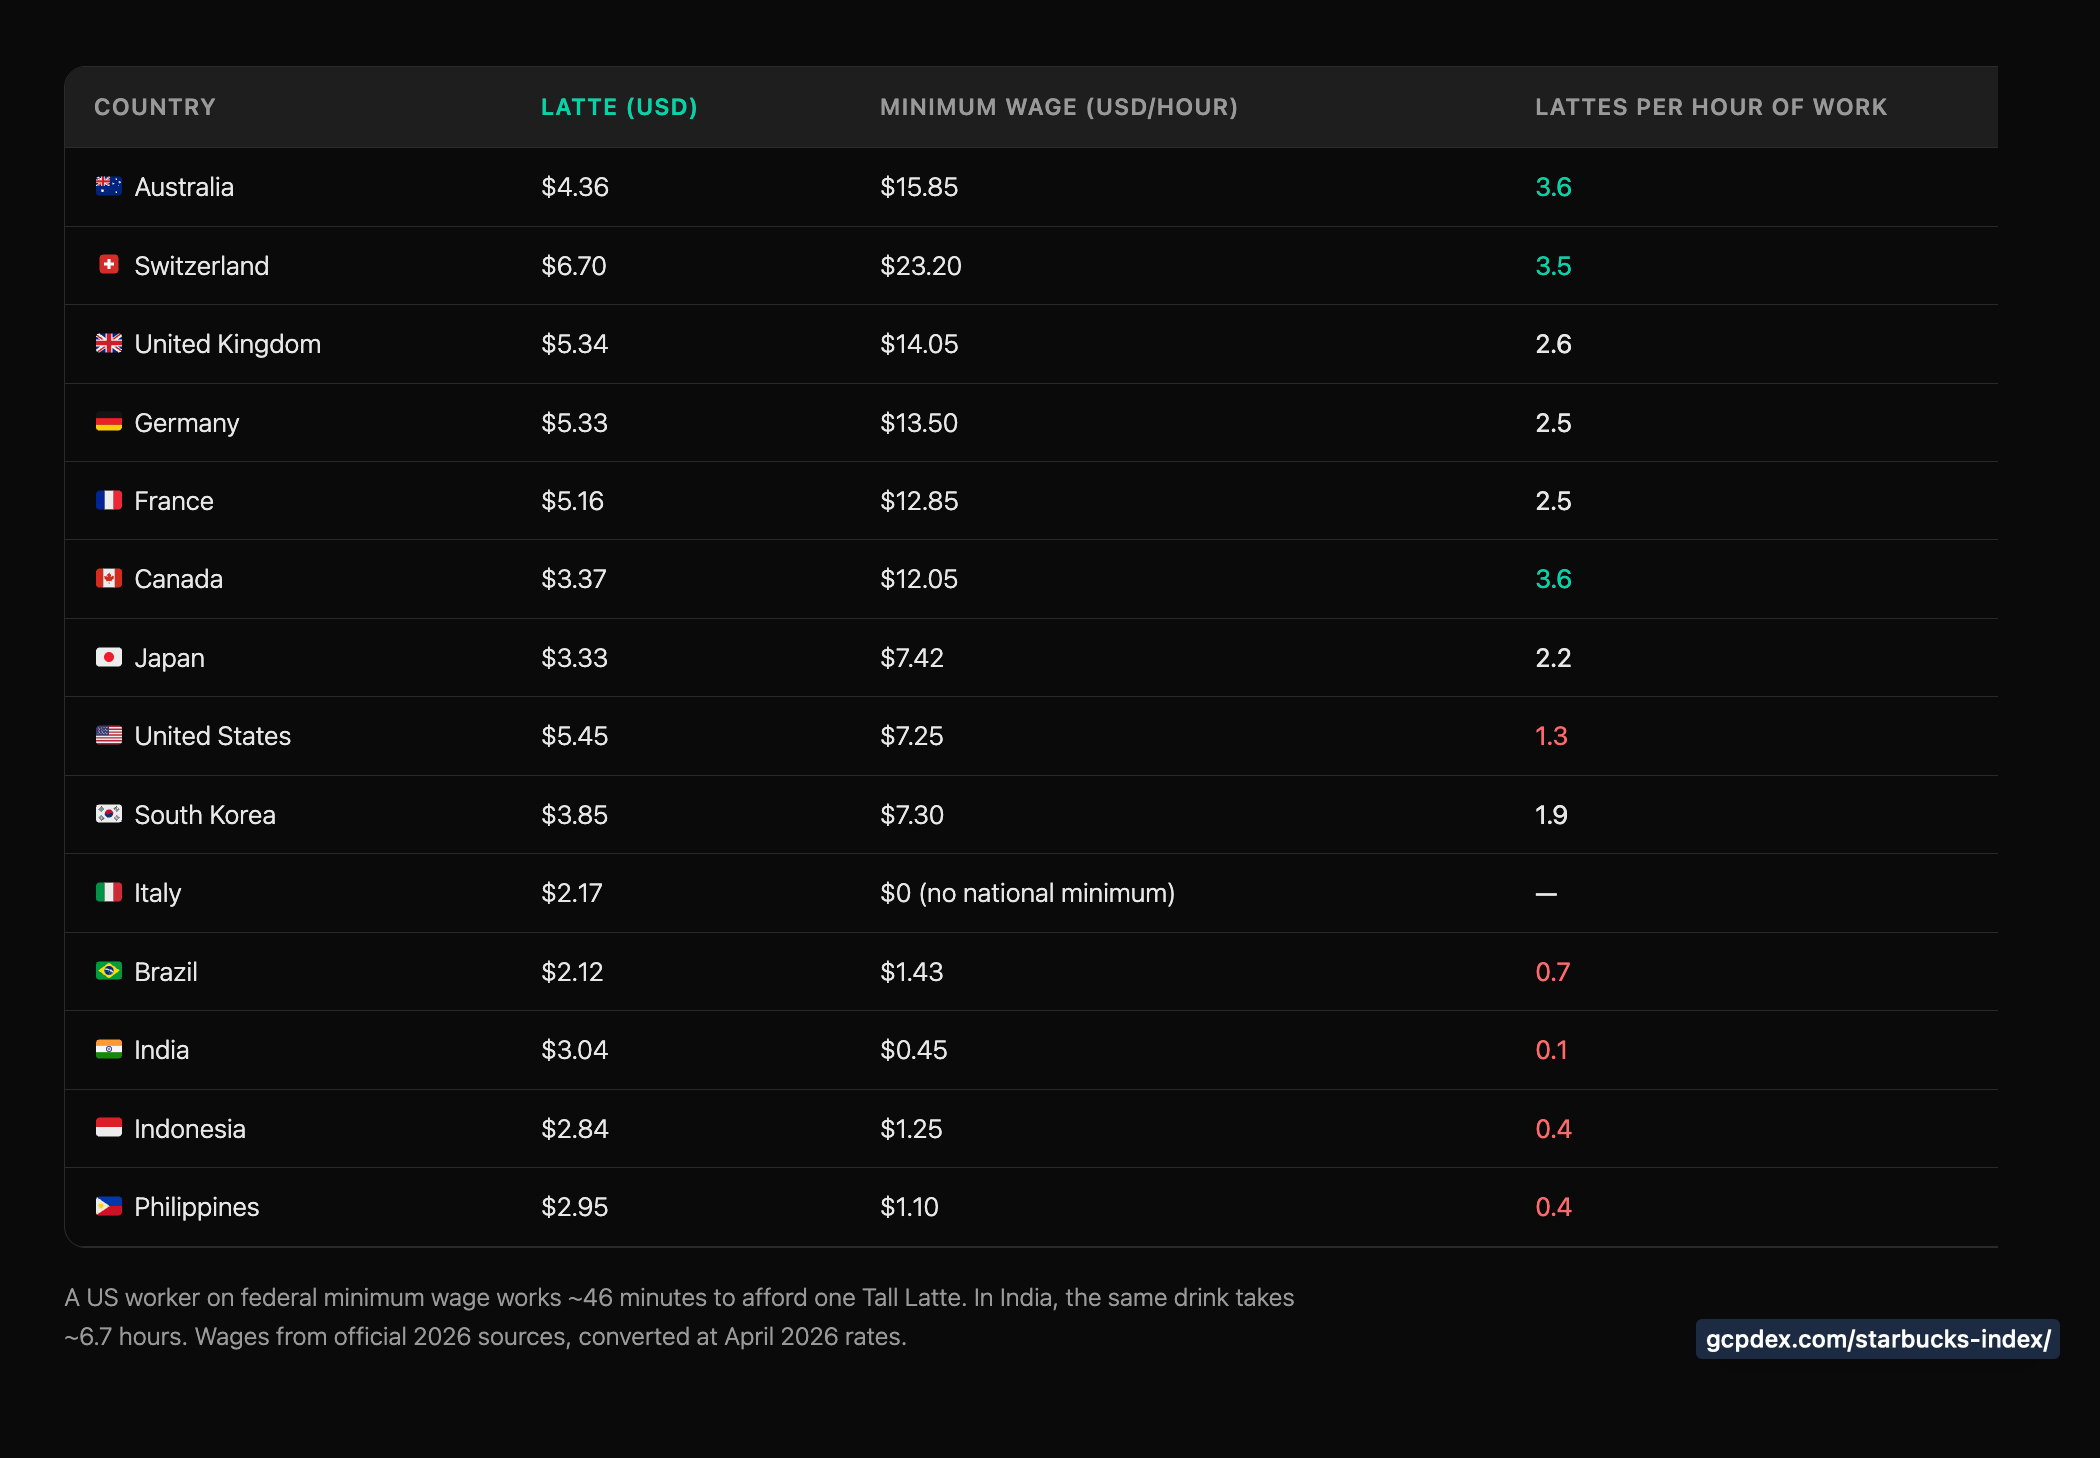
In Australia, a Big Mac (above) and a tall latte (below) are quite affordable:
Our Bottom Line: A Real Wage
A real wage indicates what we actually earn because it reflects the impact of inflation. For example, assume we earn $100 in year 1 and $200 in year 2. However, if, at the same time, a sweater’s price ascends from $10 to $20, then our real wage was the same because our purchasing power did not change. During years 1 and 2, we could buy 10 sweaters.
Recognizing that the complexities of calculating real wages can take you beyond inflation to job similarities, using Big Macs and tall lattes gives us a more consistent comparison.
My sources and more: Thanks to McDonald’s for its McWage reprise. At the same time, we should note that The Economist and this Princeton paper were our only verifiable sources of statistics.