The British government has said its corporate boards need more gender balance. But rather than a mandate, it’s giving firms a nudge. Through transparency, it hopes that by exposing male dominance at the top, it will diminish.
Recently we learned that BP and Barclays are among the firms in the U.K. that have fewer women in leadership positions.
Why?
The Worst Reasons
Moving from the bottom to the top, these are the ten worst reasons for fewer female board members. They were expressed in a U.K. gender balance report on “FTSE Women Leaders”:
- “I can’t just appoint a woman because I want to.”
- “Shareholders just aren’t interested in the make-up of the board, so why should we be?”
- “My other board colleagues wouldn’t want to appoint a woman on our board.”
- “There aren’t any vacancies at the moment – if there were I would think about appointing a woman.”
- “We need to build the pipeline from the bottom – there just aren’t enough senior women in this sector.”
- “We have one woman already on the board, so we are done – it is someone else’s turn.”
- “I don’t think women fit comfortably into the board environment.”
- “There aren’t that many women with the right credentials and depth of experience to sit on the board – the issues covered are extremely complex.”
- “All the “good” women have already been snapped up.”
And the top reason?
- “Most women don’t want the hassle or pressure of sitting on a board.”
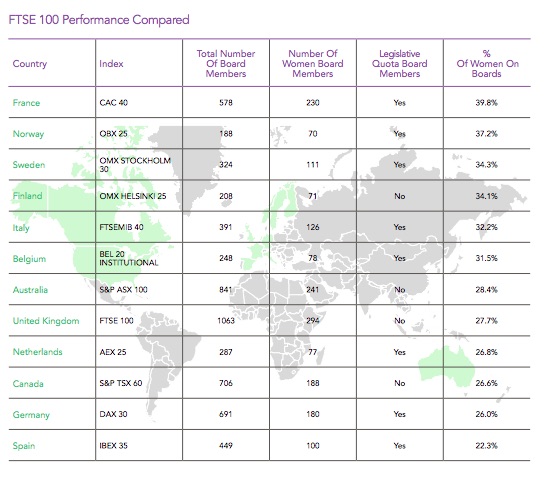
So you see the rationalizations. Women don’t fit in, they don’t want it, we have enough, and no one really cares. Statistically, the result has been minimal progress. If, like me, you want the precise data, do look at the graphics I’ve shared from the U.K.’s November 2017 Hampton-Alexander Review of “FTSE Women Leaders.”
Some Gender Balance Numbers
These percents are for females on boards:
They compare poorly to these numbers:
 Our Bottom Line: Human Capital
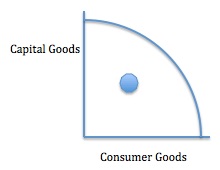
When there are fewer women on boards, we can assume that some of the best and the brightest talent has been ignored. An economist would call it human capital underutilization. To illustrate that underutilization, she would use a production possibilities graph.
On the following production possibilities graph, the curve represents an economy’s maximum production capability. In order to show female talent being underused, we place the current production dot inside the curve:
The dot also displays the inefficiencies created by our top ten worst reasons list.
My sources and more: Since we have not looked at the female board membership glass ceiling for four years, it was time to return. The newest developments have come from the U.K. and this FT article. But if you want to see the original source, do look at this very readable Hampton-Alexander Review.


