![econlifelogotrademarkedwebsitelogo[1]](/wp-content/uploads/2024/05/econlifelogotrademarkedwebsitelogo1.png#100878)


What We Can Learn From a $20 Burrito
September 9, 2026
For the large cities identified below, you can see if the child population went up or down from 2015 to 2024: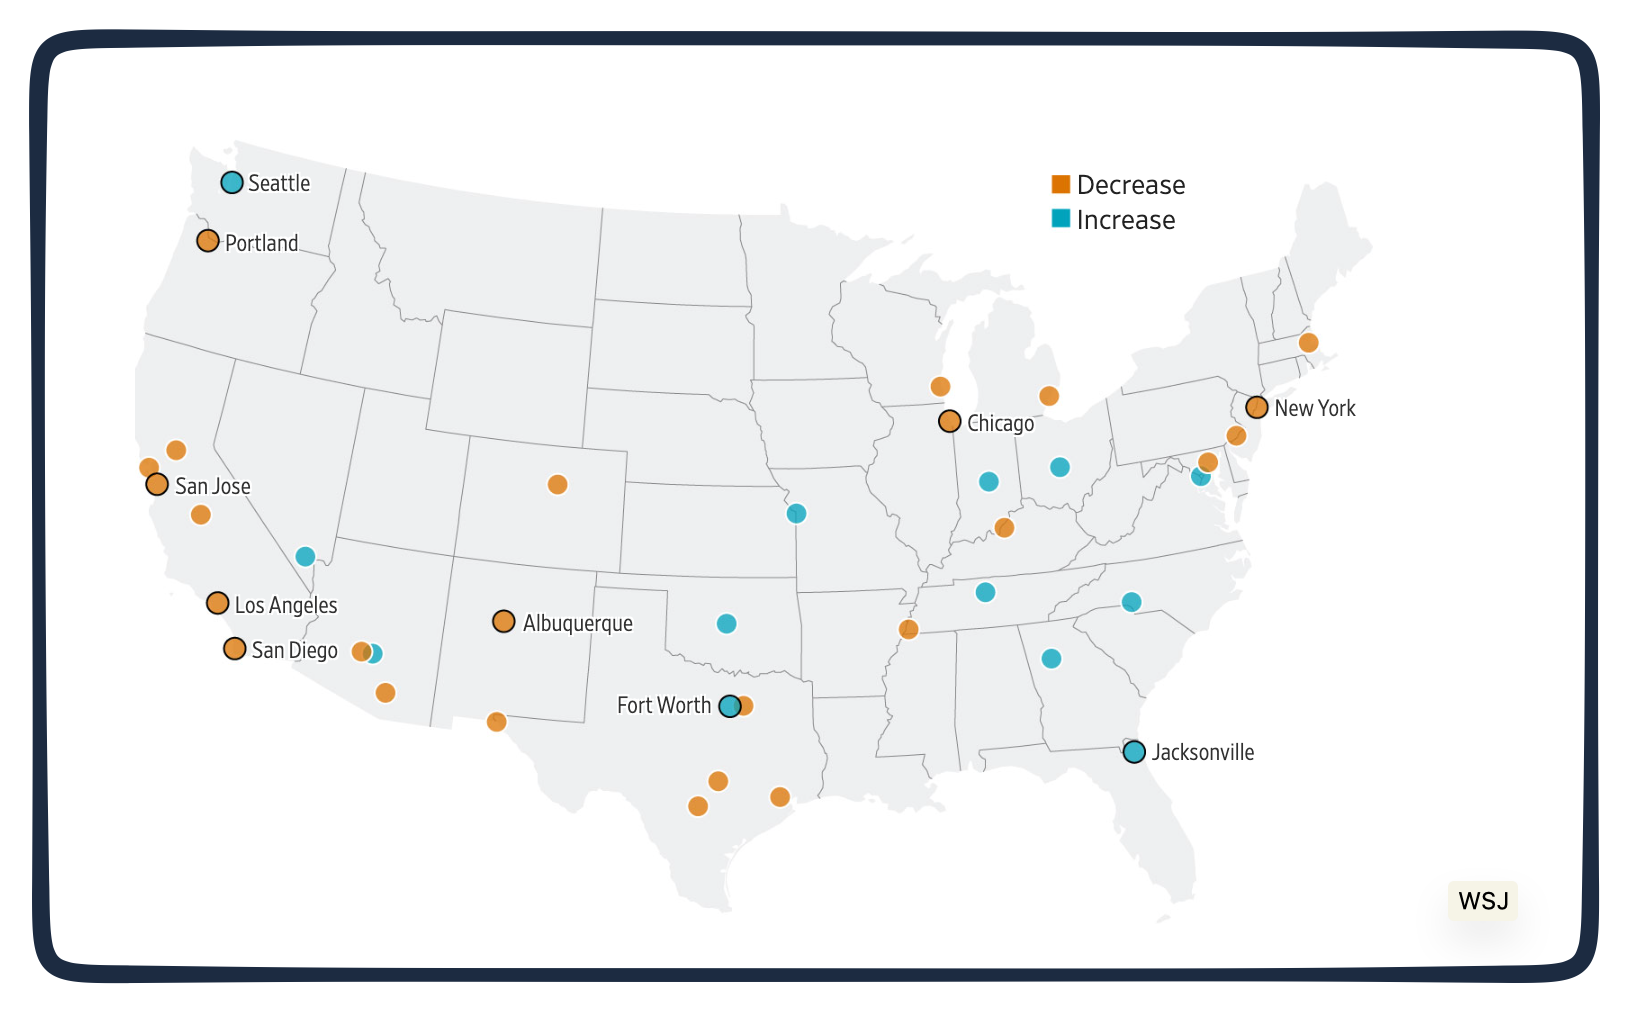
With many more orange dots, the map’s message is a plunge in the under-18 popula†ion of many cities.
Urban Fertility
While the average baby decline in the U.S. is 1 percent, cities report an average of 6 percent. Even higher for children under five years old, the big city decrease is 15.4 percent. Trying to figure out what is happening, researchers looked at birth rates and moving rates, and saw a combination of the two.
New York
Like many cities with a lower kids population, money is one reason. Dominated by middle-income families, the exodus from New York reflects a $334,000 annual income needed to afford a 2-year-old. It includes a median monthly rent of $5,495, which adds up to a yearly outlay exceeding $65,000 on rent alone.
Two large urban exceptions are Seattle and Washington, D.C.:
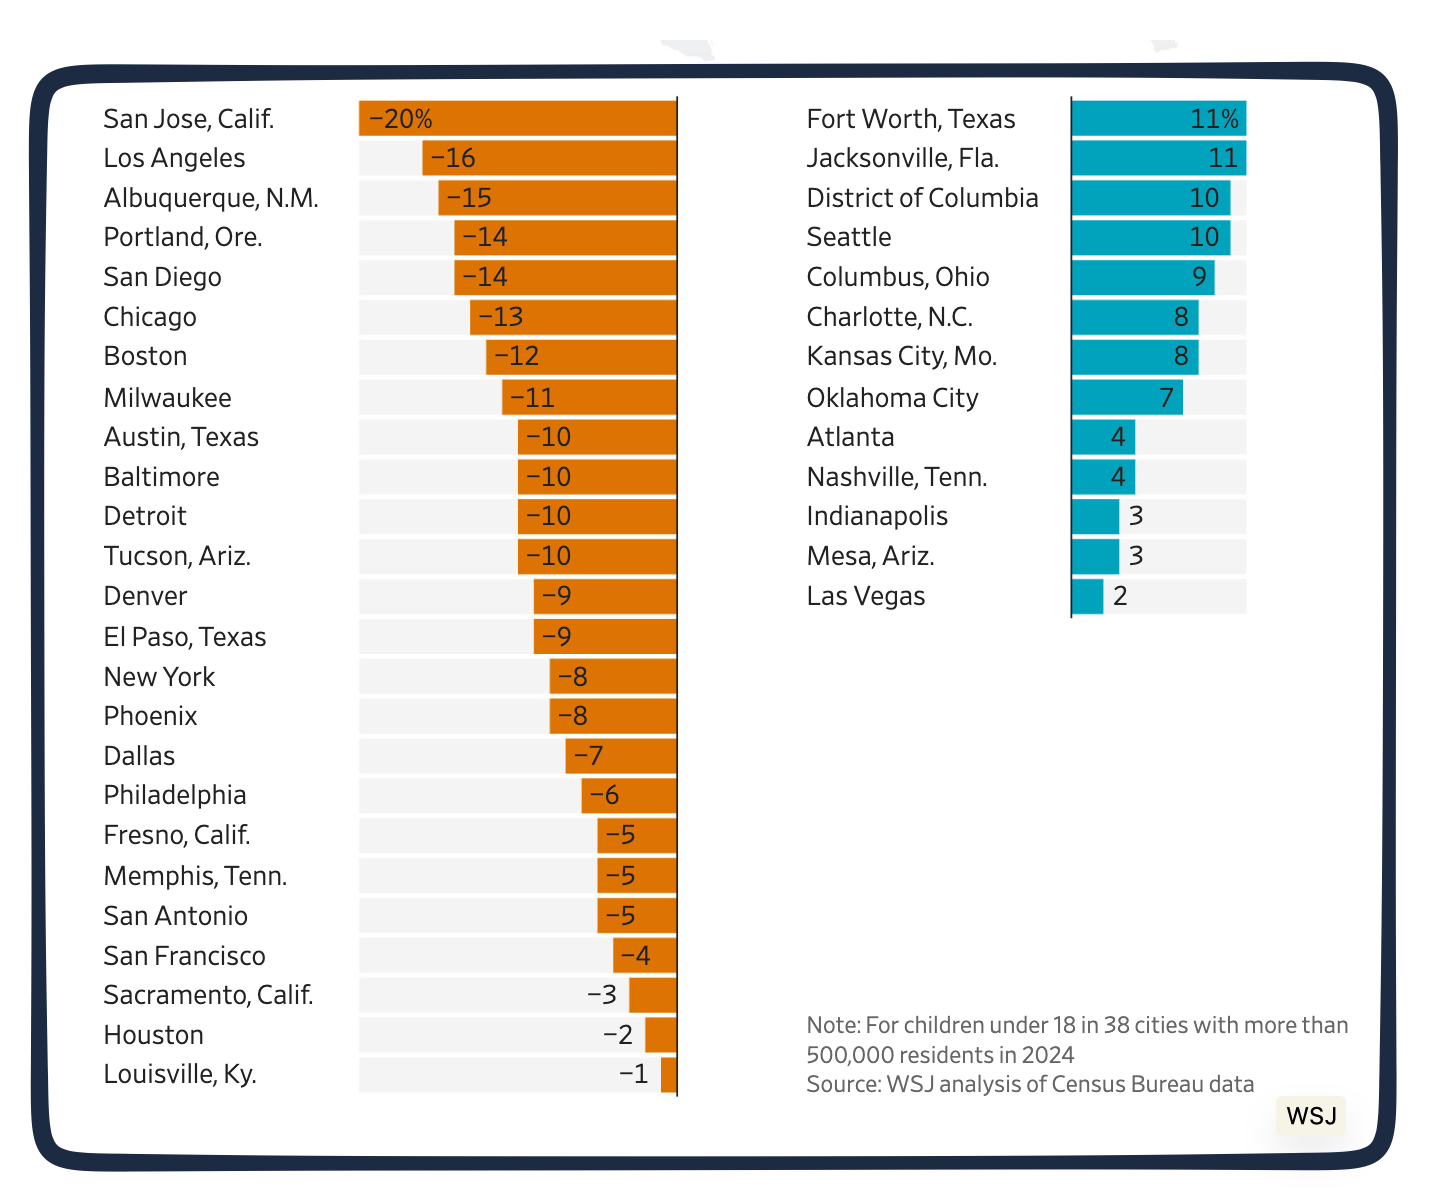
Washington, D.C. and Seattle
Meanwhile, Washington D.C. and Seattle have the high-paying jobs and quality schools that appear to have retained the baby-producing people. With a bigger number of high-income families having children and those below $100,000 in the smaller cohort, we again see money making the difference. In Washington D.C., there was massive gentrification when college-educated families moved in to what had been Black communities from 2000-2016. Then, cultural opportunities retained families, with the suburbs no longer such a cheap alternative. Similarly, Seattle attracted a higher-income tech population
Never simple, the situation could be changing. Since the pandemic, D.C.’s number of births is down from its peak in 2016. Correspondingly, the number of kids under 5 is down while the number of children remains up. With Seattle, as much it appears to have more young children compared to other cities, relative to its size, the number of children remains small.
So where are we?
Our Bottom Line: Replacement Rates
One number can convey a summary. Called the replacement rate, it just tells us how many babies per woman we need to maintain our population. While the replacement rate is 2.1, the recent U.S. rate is 1.6:
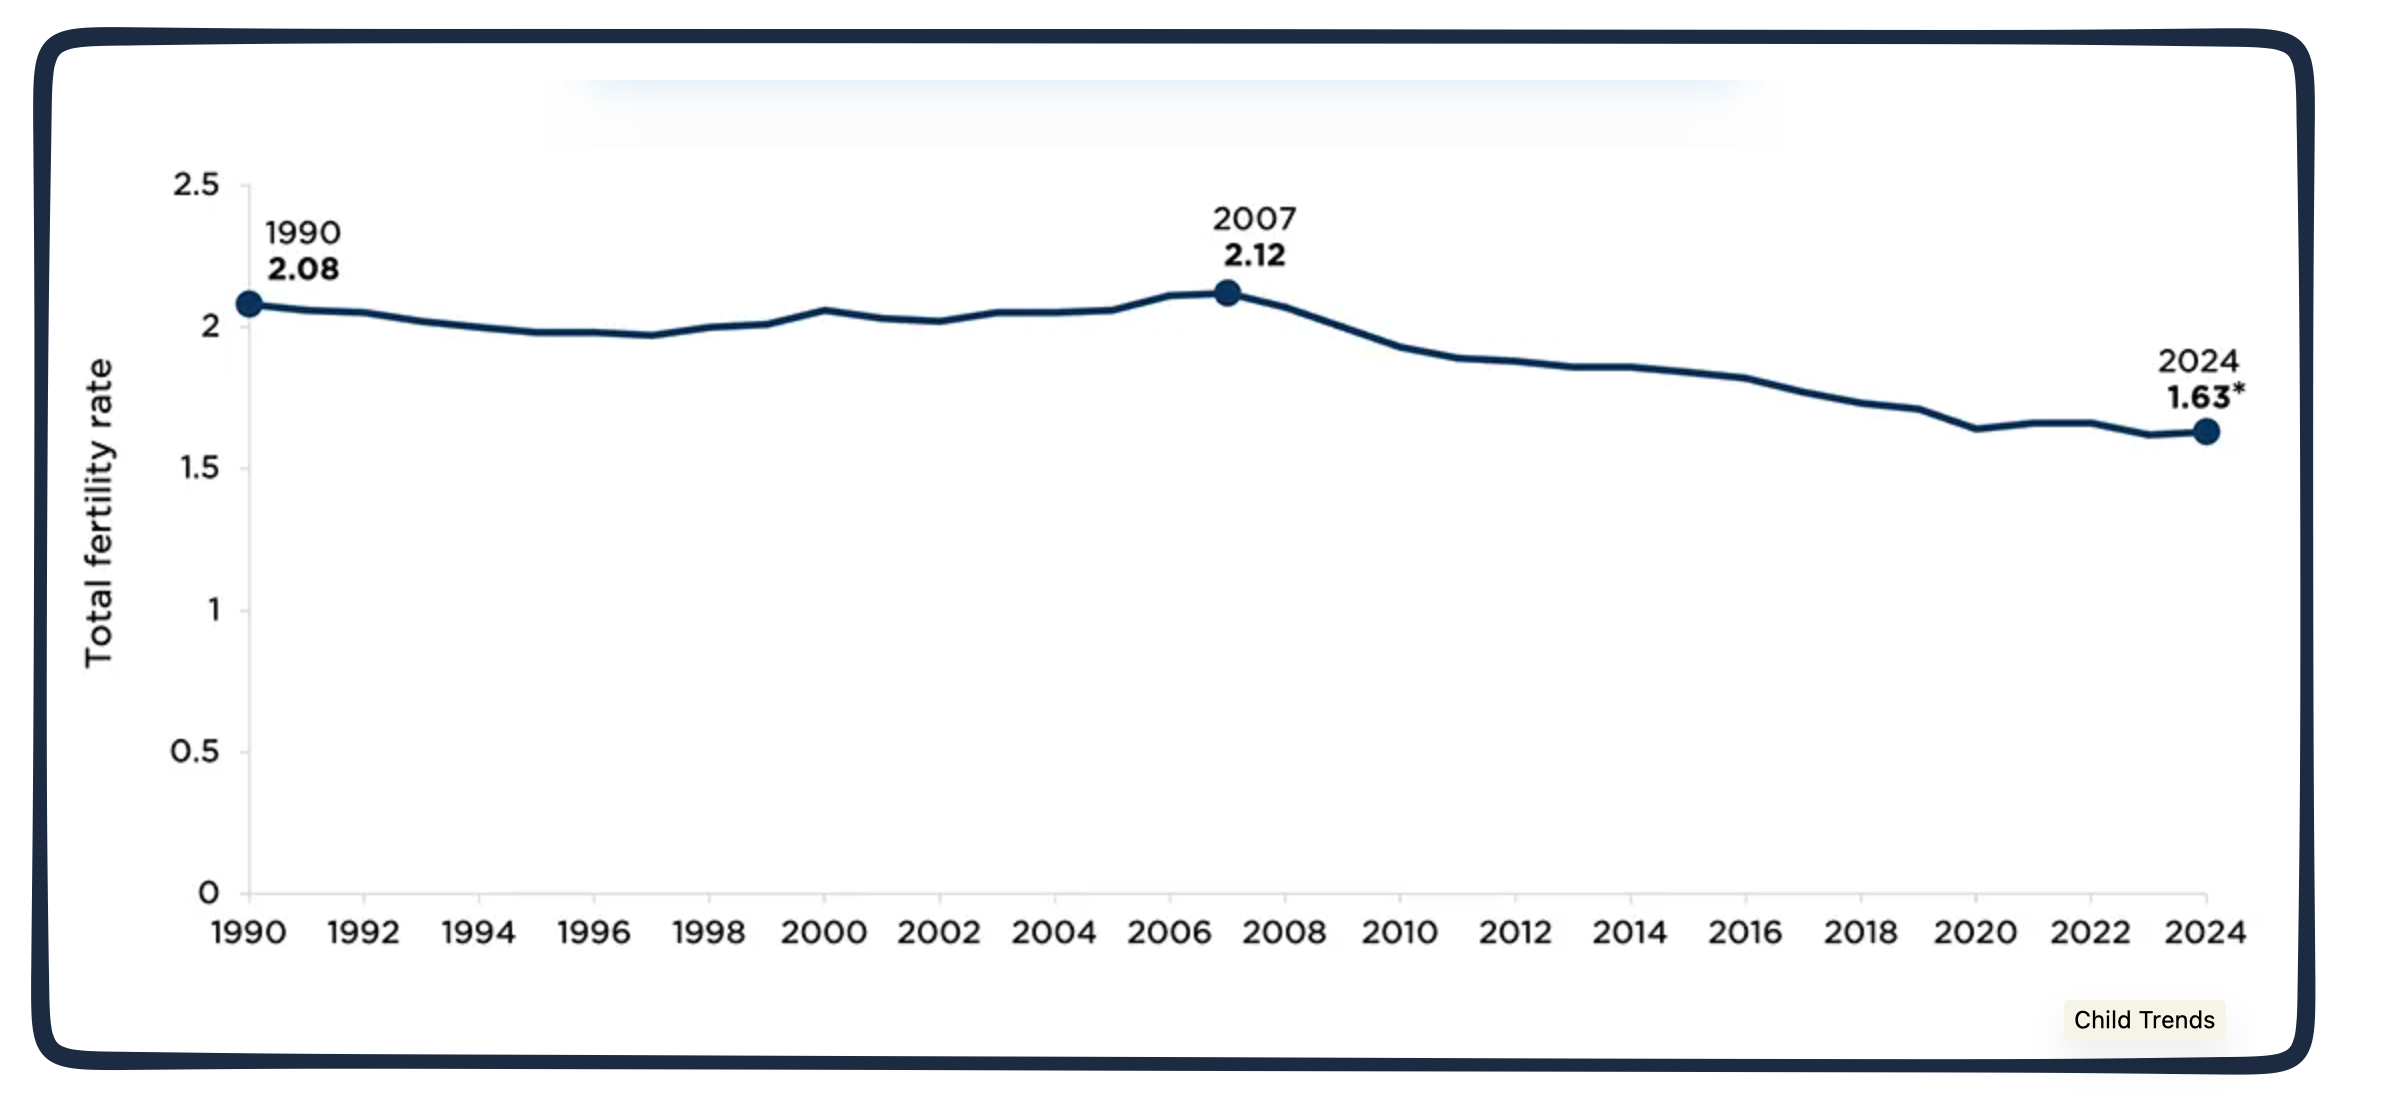
1.6, though, does not say what fewer babies mean for supporting a larger elderly population nor how the fabric of cities will change with fewer children. It does not explain the relevance of what the NY Times calls an “Age of Insecurity.”
Returning to our title–your answer?
My sources and more: Today’s facts mostly came from two Wall Street Journal articles, here and here. Also, this NY Times article was helpful, as were Bloomberg and Child Trends.