![econlifelogotrademarkedwebsitelogo[1]](/wp-content/uploads/2024/05/econlifelogotrademarkedwebsitelogo1.png#100878)


The Fruity Pebbles Lawsuit
August 12, 2026
6 Facts: What We Need to Know About Tariffs
August 14, 2026
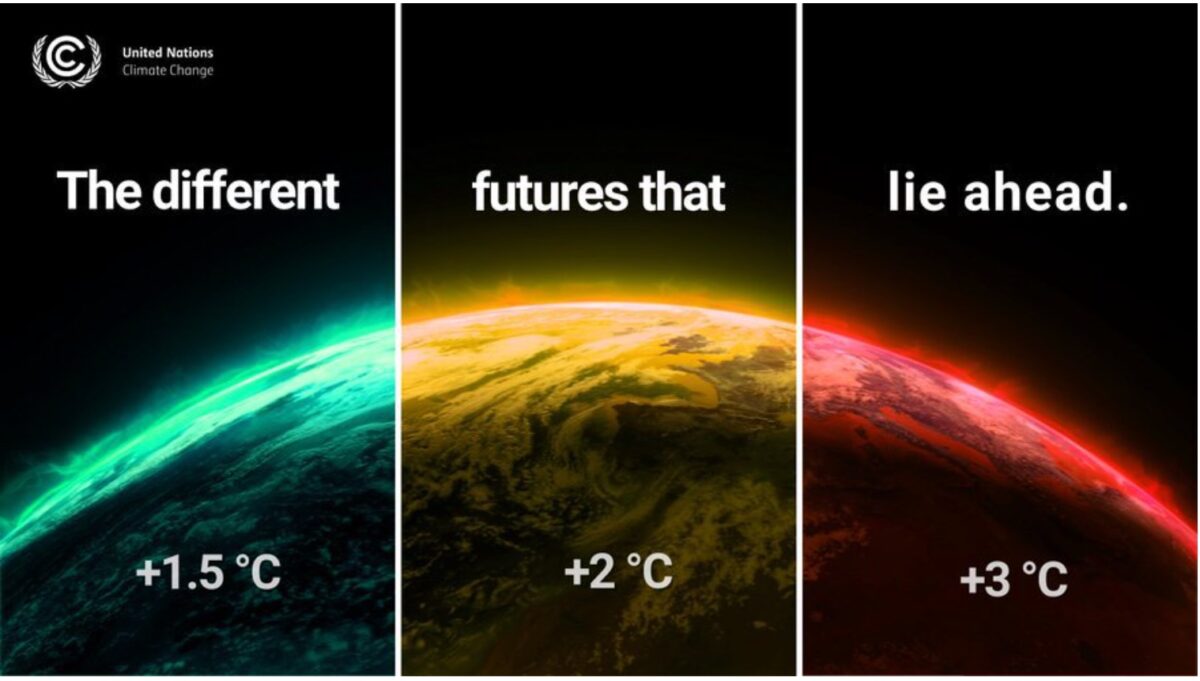
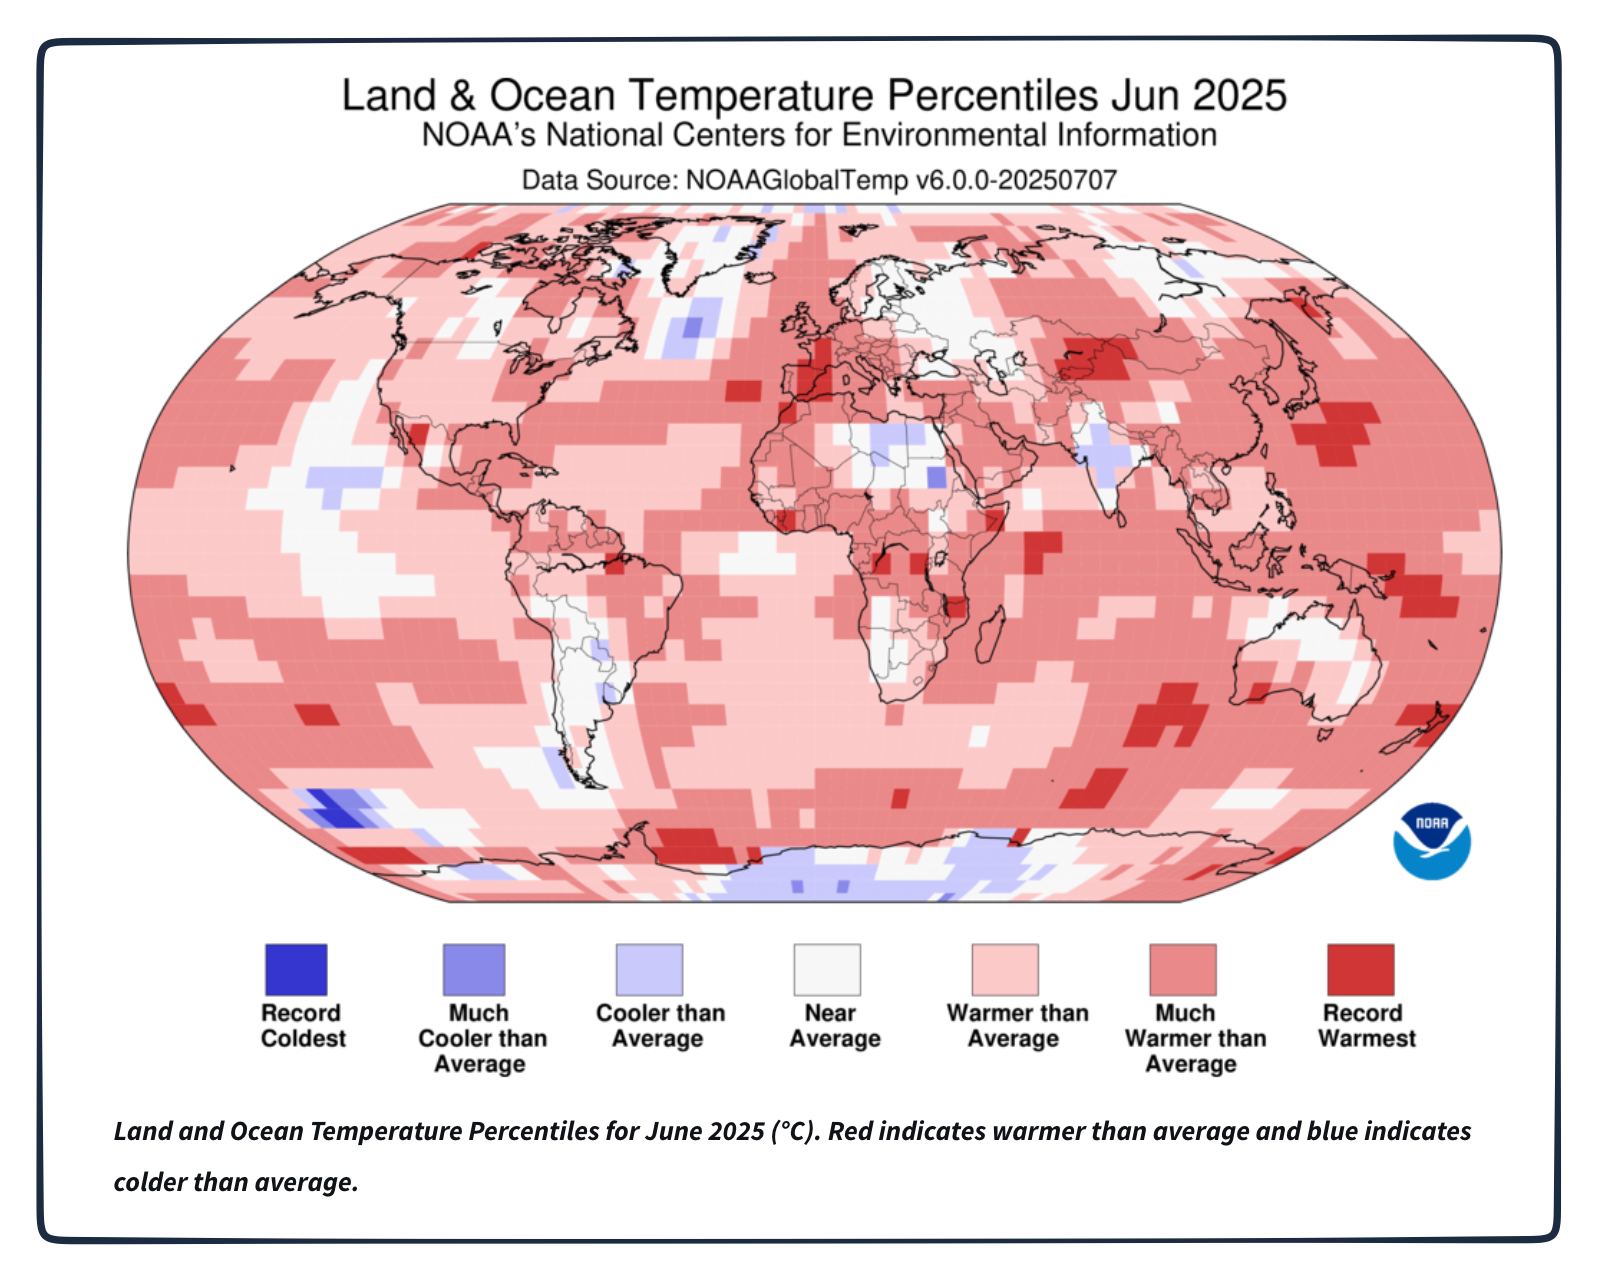
Few of us know that, during the past 176 years, June 2025 global surface temperatures were the third warmest. But we do remember the devastation from Hurricane Katrina in 2005.
Last year’s global heat:
A name makes the difference
Naming Heat Waves
Heat Wave Impact
This July was a record setter. In the contiguous United States and in Europe, June to July temperatures touched their hottest averages. On the supply side, we felt the impact because extreme heat reduces the efficiency of gas turbines, dams, solar panels, and wind turbines. At econlife, we saw nuclear power shutdowns because local rivers had less cooling potential. Correspondingly, demand for AC and refrigeration can soar by almost 20 percent as it did in France during a two-week June 2026 heat wave.
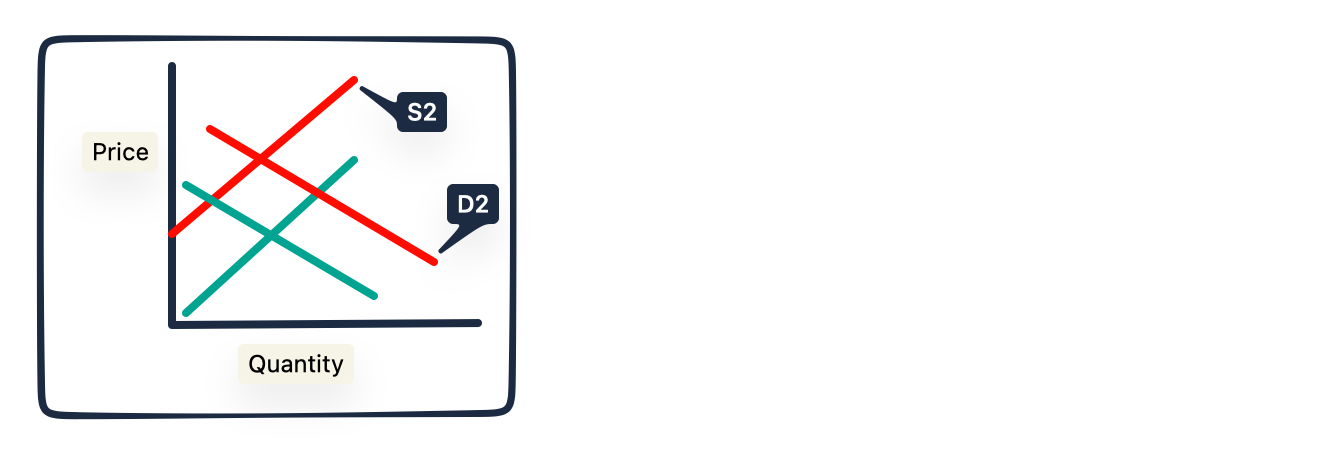
On our graph, we know that shifting supply to the left (S2) and demand to the right (D2) elevates energy’s equilibrium price:
In addition to their current impact, heat waves trickle into the future. Estimates indicate there were 1,300 excess deaths in Europe by the beginning of this July. Furthermore, if France and other exposed countries, including Germany and Spain, were to experience their five hottest years in succession, their GDP would have sunk by 5 to 7 percent. Also, heat waves boost future food prices as well as government spending on repairing infrastructure, installing AC, and caring for health emergencies.
Our Bottom Line: Measurement
Citing the statistics that we regularly record like the GDP and the Dow, economists say that we “treasure what we measure.” Similarly, because Seville, Spain, named a 2022 heat wave Zoe, more people remembered the event. Taking a bit of a leap, we can also assume that, like the GDP, CPI, and Zoe, a name would encourage us to “treasure what we measure.” Then, as a result, we would create heat action plans (HAPS).
My sources and more: With heat waves at record levels, it was time for econlife to return to them. Starting with WSJ and the NY Times, we got a weather update. Then, papers here, here, and here came in handy for heat wave stats. And finally, we completed our statistical picture here and here.