![econlifelogotrademarkedwebsitelogo[1]](/wp-content/uploads/2024/05/econlifelogotrademarkedwebsitelogo1.png#100878)


What World Cup Ticket Prices Tell Us
July 1, 2026
Why North American Trade Needs To Be Free
July 3, 2026
On June 30th, UBS published its Global Wealth Report 2026.
Let’s take a look.
6 facts: Global Wealth
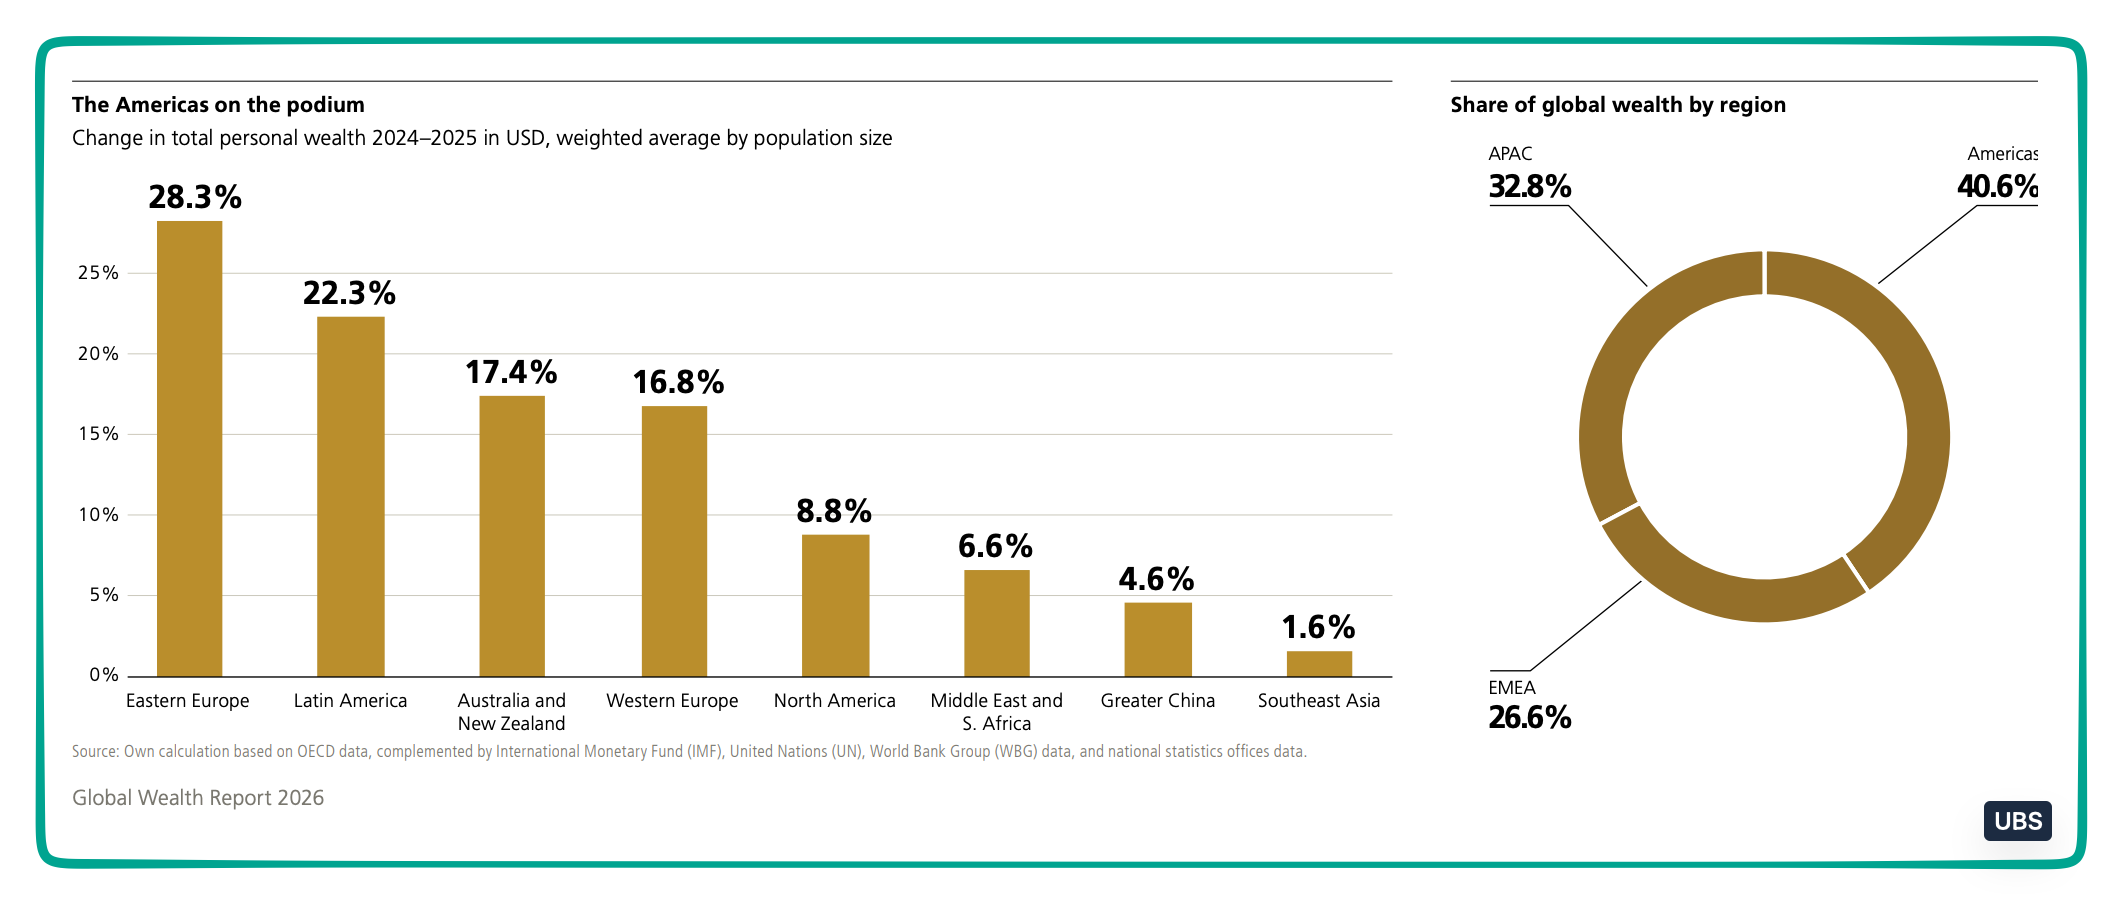
1. Measured in USD, personal wealth grew rapidly.
But we have to go to Eastern Europe to see the biggest pop:
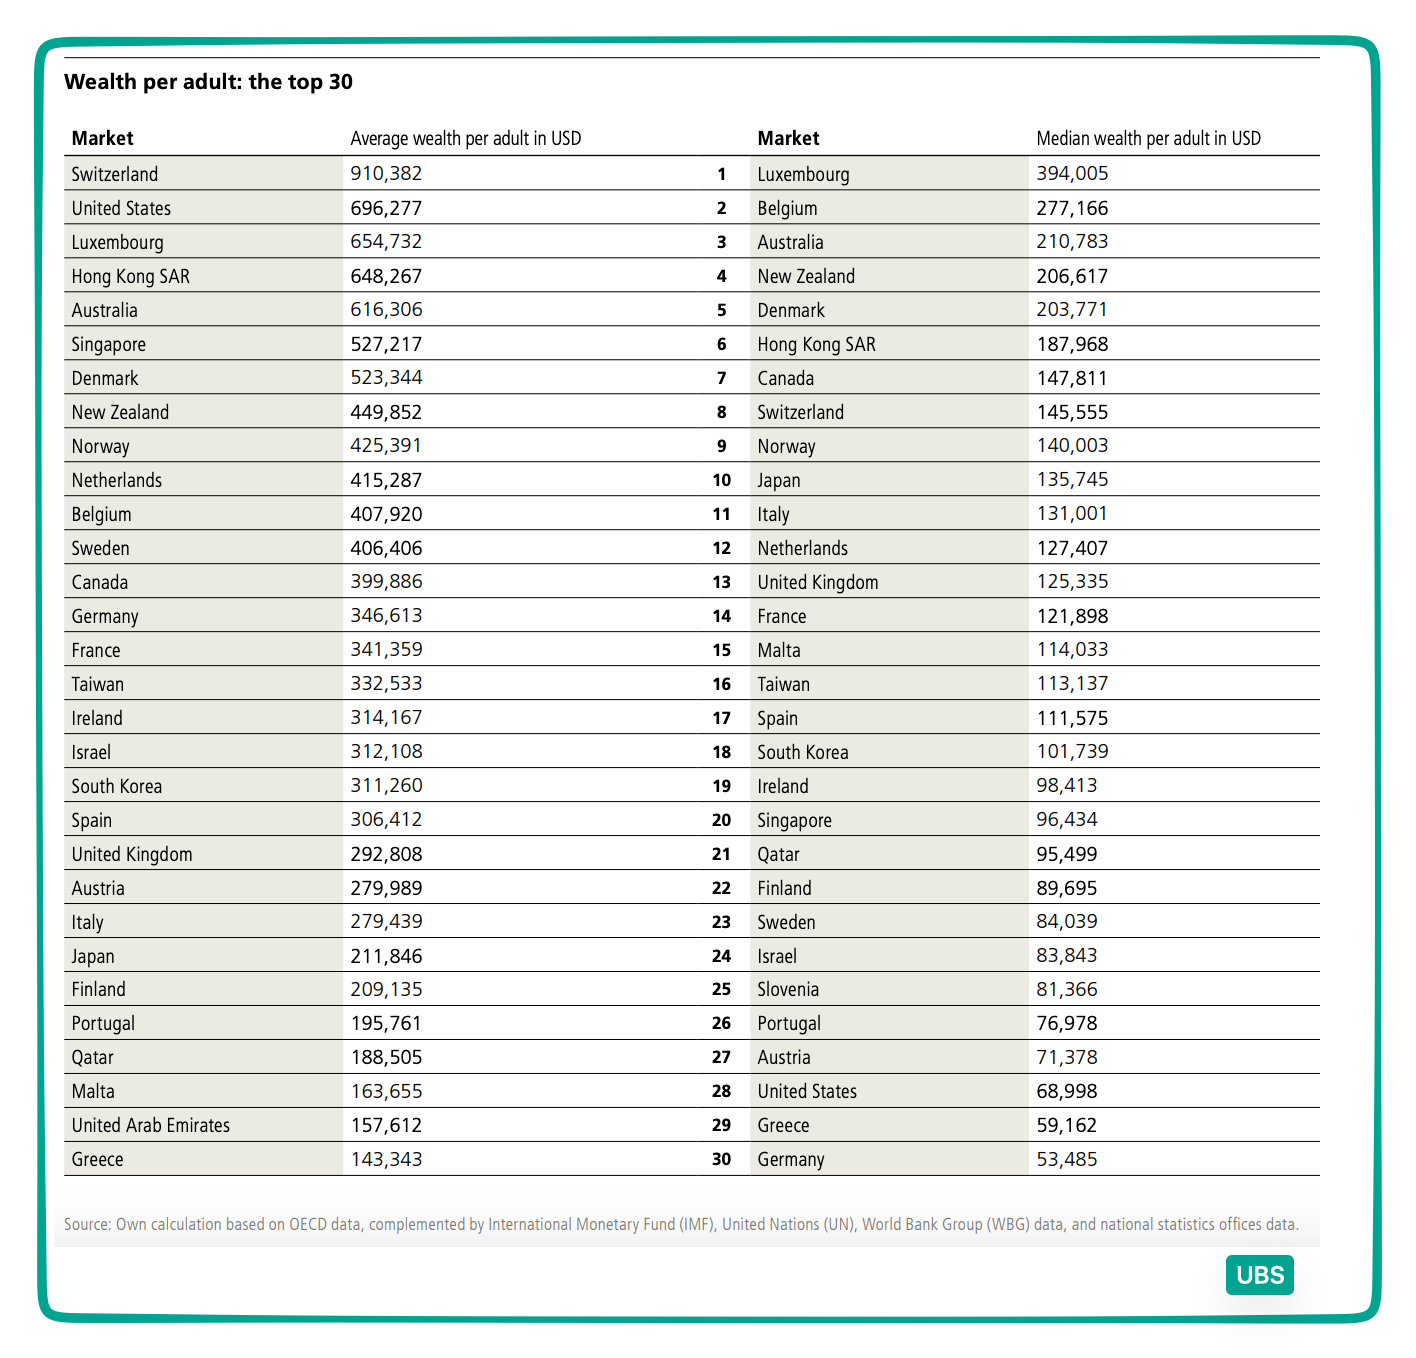
2. Meanwhile, the averages take us to the most affluent countries.
Switzerland and Luxembourg top lists of average and median wealth:
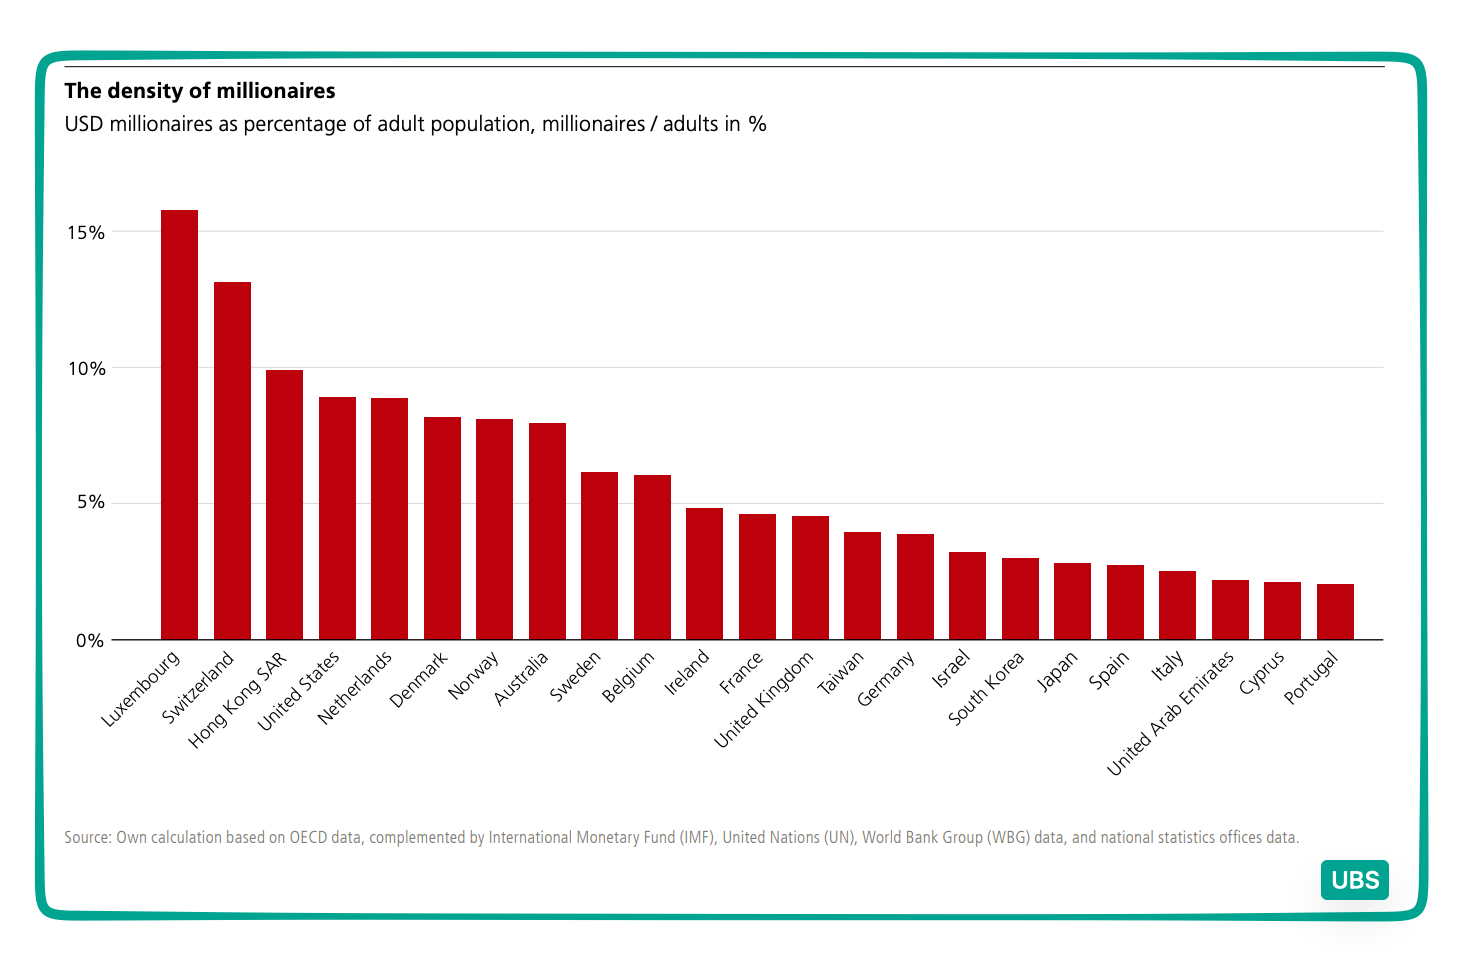
3. Looking through a different lens, we can locate the most millionaires.
Whereas we would find the most millionaires in the United States (23.6 million), mainland China (5.2 million), and Japan 2.9 million), we are most likely to bump into a millionaire in Luxembourg or Switzerland:
4. In the United States, generational wealth varies.
But by far, the Baby Boomers accumulated the most wealth. Among households worth $30 million and more (430,000 households), Baby Boomers (born 1946-1964) account for close to two-thirds.
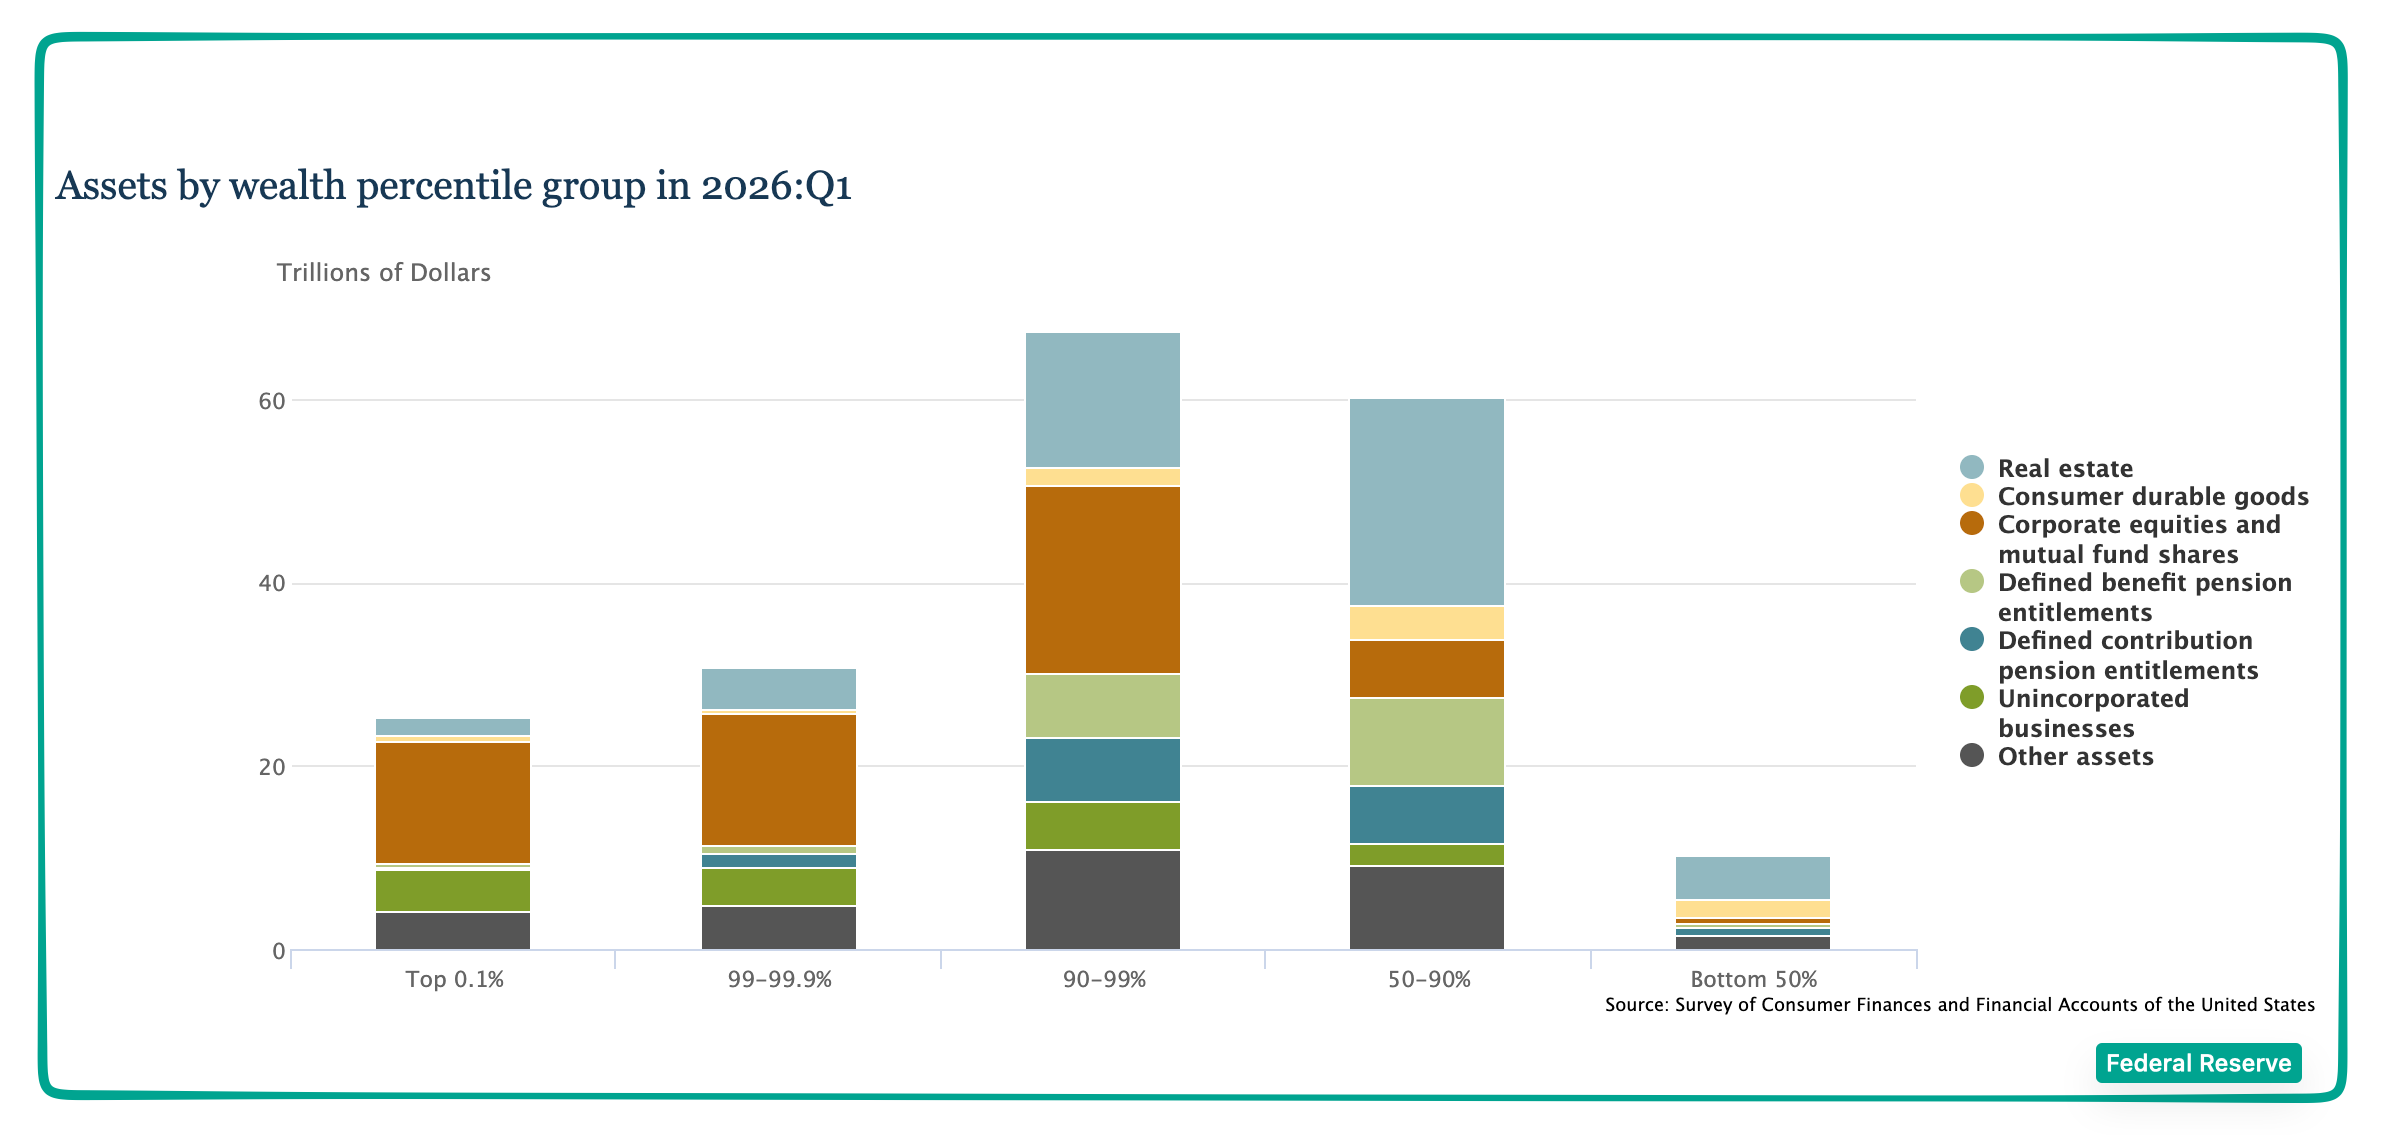
5. Looking more closely, we would see that our wealth determines the kinds of assets we own.
According to the Fed, private businesses, corporate equities, and mutual fund shares fueled the recent rise in the net worth of the wealthy in the U.S. Correspondingly, as wealth increases, real estate becomes an increasingly smaller proportion:
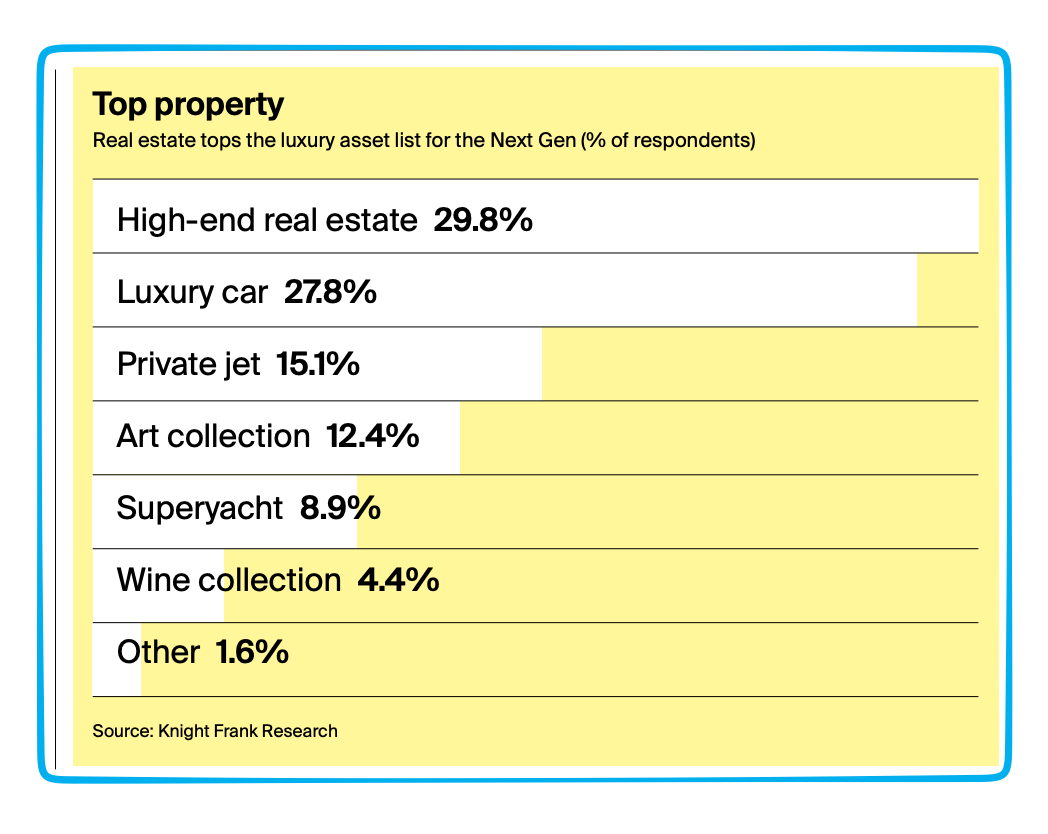
6. Our wealth also determines the luxuries we can purchase.
In the Knight Frank Wealth Report, respondents indicated the luxury asset they would most like to own:
Our Bottom Line: Gini Coefficients
As a final thought, we can look at income distribution through the lens of a Gini Coefficient. Using a scale of 0 to 1, the Gini Index quantifies inequality in a country. The higher the number, the more unequal the distribution of income or consumption expenditures. Consequently, zero is perfect equality while 1 is complete inequality.
Based on their Gini coefficients, the Scandinavian countries are most equal:
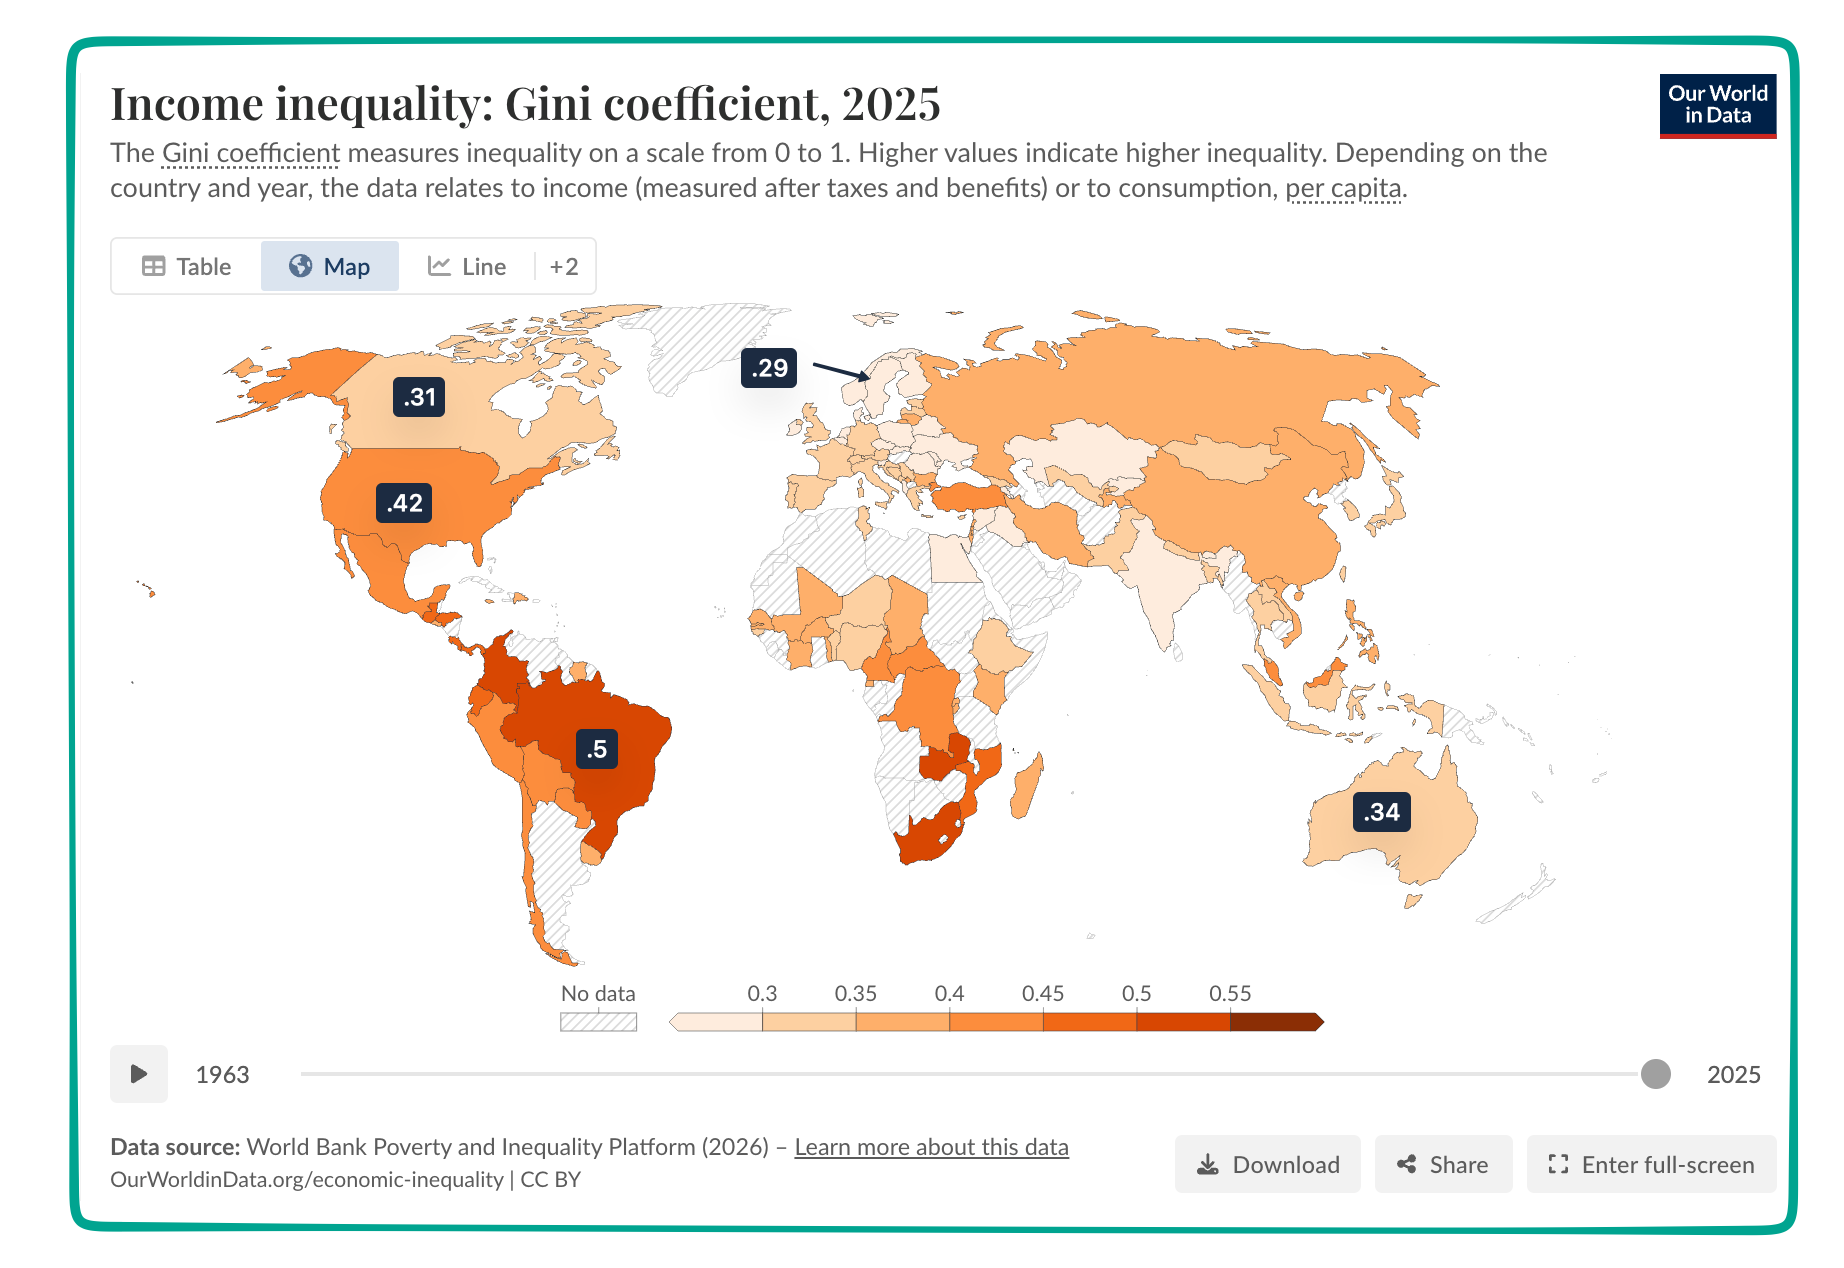
In a list we might not want to top, for the G-7 countries (U.S., U.K., Italy, Japan, Canada, Germany, France), the U.S. has the highest Gini Coefficient. As for the rest of the world, Norway, Sweden, and Finland were among the nations with the lowest Gini Coefficients whereas Brazil was up there with a much higher number:
My sources and more: Thanks to the UBS Global Wealth Report 2026 for most of today’s facts and graphics. However, we found more at the Fed’s DFA, and the Knight Frank report.
Please note that several of today’s sentences were a past econlife post.