![econlifelogotrademarkedwebsitelogo[1]](/wp-content/uploads/2024/05/econlifelogotrademarkedwebsitelogo1.png#100878)


How China Might Avoid the Middle Income Trap
October 20, 2024
The Correlation Between Starbucks and Startups
October 22, 2024
During 1980, with an election to win, Ronald Reagan (reputedly) gave the Economic Discomfort Index a new name. Seeing it soar, he called it the Misery Index. He won the election against Jimmy Carter and the Misery Index was born.
Based on the Misery Index, we should be pretty happy.
The Misery Index
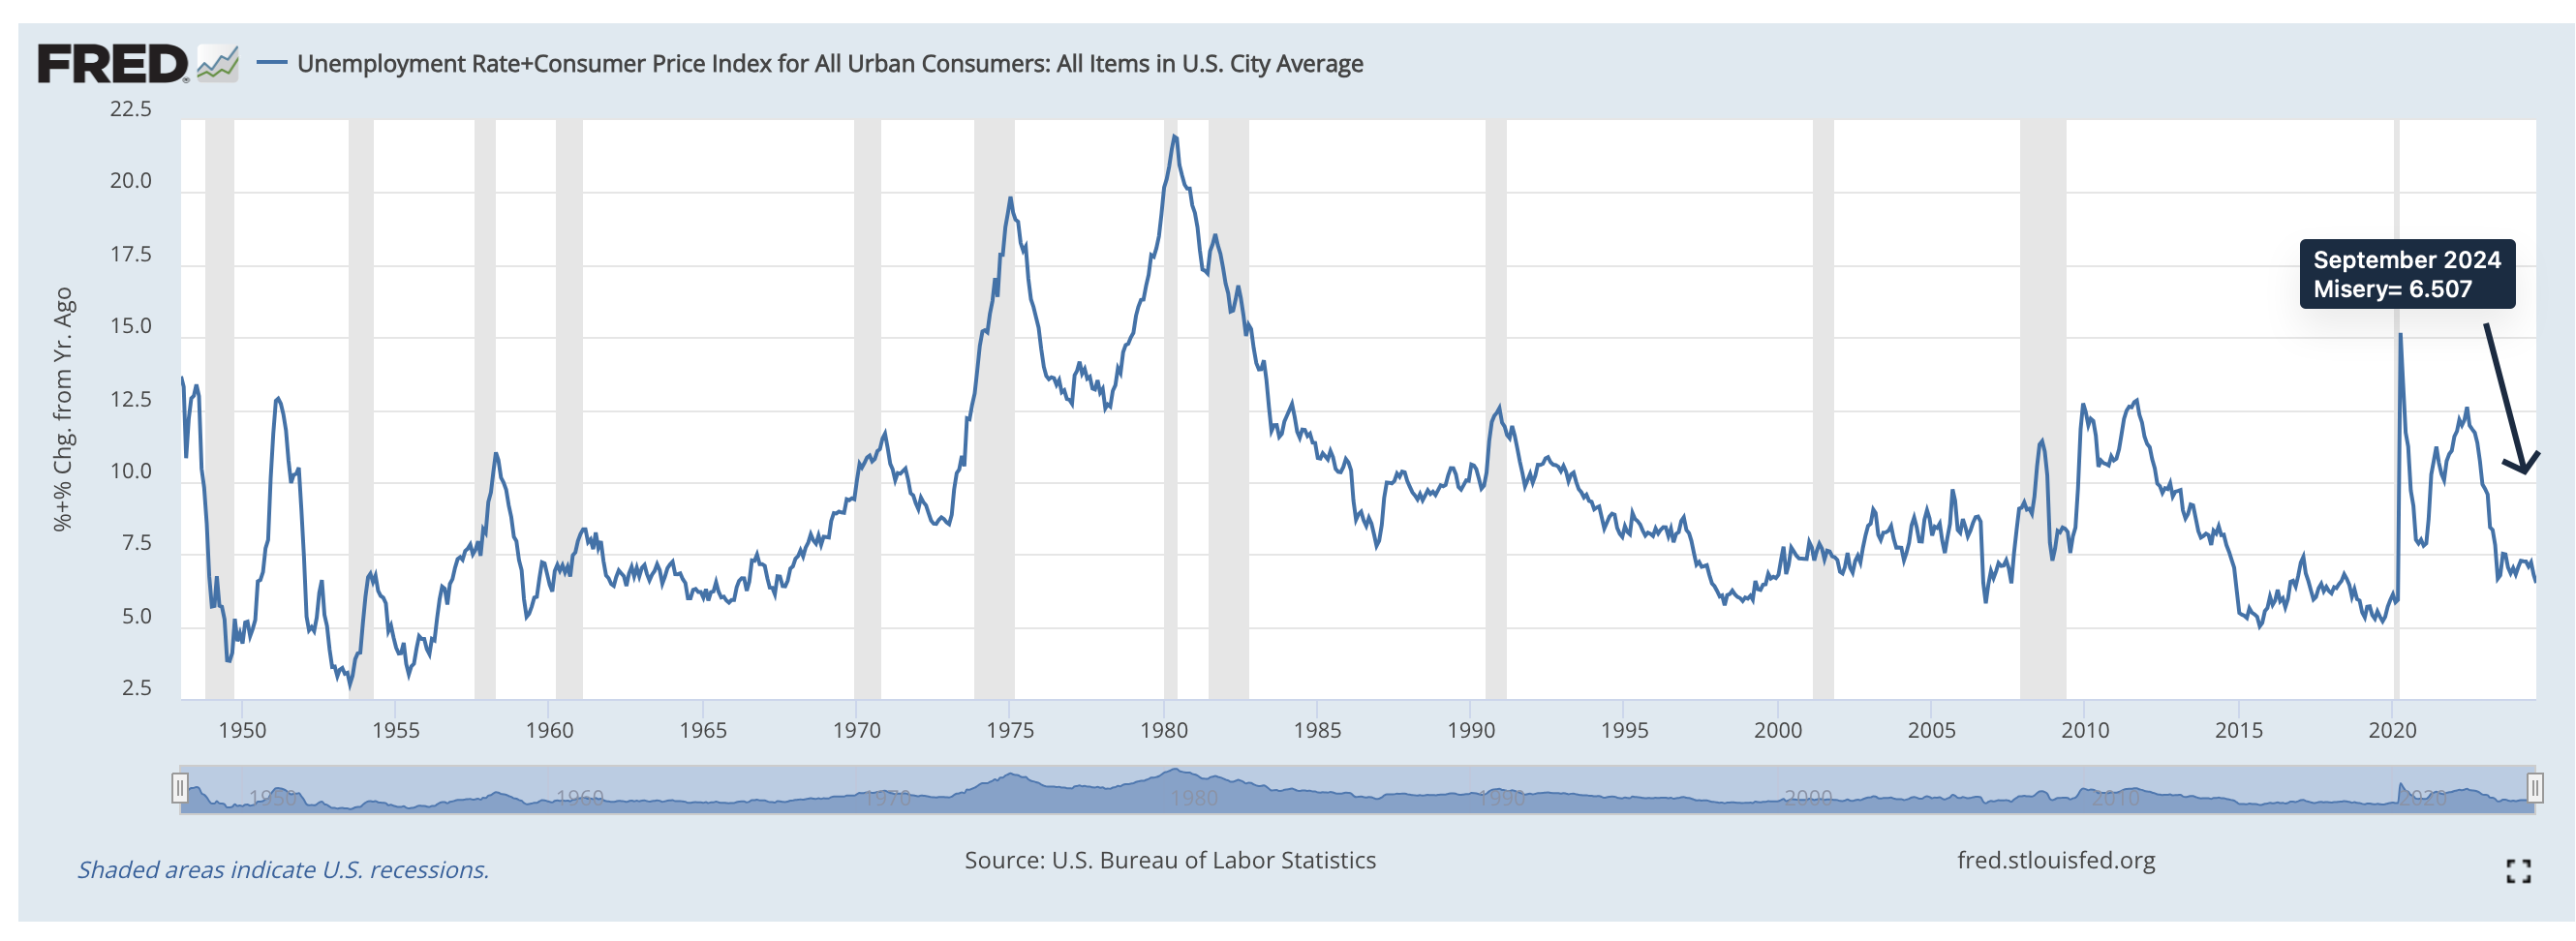
To calculate the simplest version of the Misery Index, we just add together the annual inflation rate and the unemployment rate. Below, you can see its peaks from the mid-1970s to the early 1980s:

The September 2024 Misery Index
Fast forwarding to now, we can ask about our own Misery. At 6.5, the September Misery Index is a happy number. Combining 4.1 percent unemployment and a 2.44 percent inflation rate, it is quite low.
Shown by the dip in the FRED graph, historically also, our misery should be miniscule:
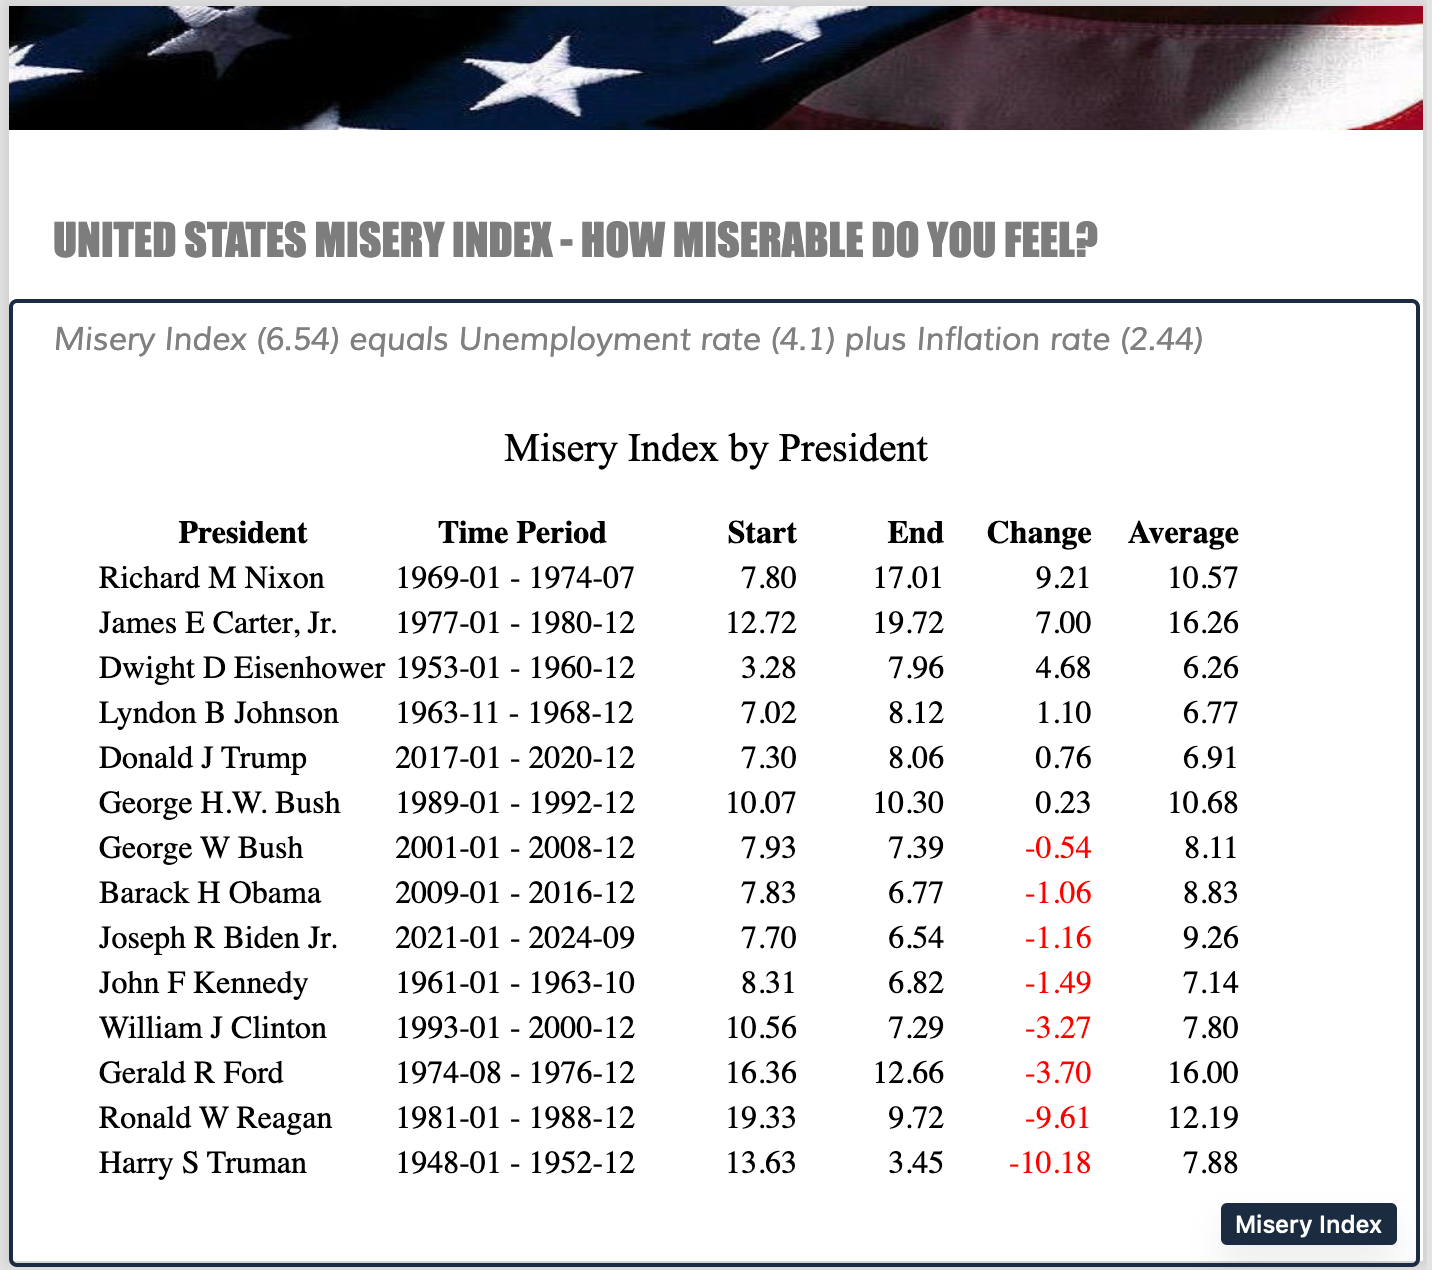
Political Misery
Below, comparing presidents, the Change column dictated the order. It starts with the worst performance and ends with the best. So, for Richard Nixon, Misery ascended by 9.21 during his presidency. By contrast the plunge was more than 10 when Harry Truman was president. The numbers also indicate that Misery increased during the Trump presidency and decreased with Joe Biden:
Our Bottom Line: Okun and Hanke
We can thank two economists for measuring our misery.
Arthur Okun
When President Lyndon Johnson wanted a quickie take on the U.S. economy, his chair of the Council of Economic Advisers, economist Arthur Okun (1928-1980), came up with the Economic Discomfort Index. Simply the sum of the unemployment and inflation rates, it measured economic distress. And yes, it does make sense that when purchasing power dips and joblessness climbs, there are fewer smiles. Ronald Reagan also understood the power of a number.
Steve Hanke
Taking the idea a step further (from where a Harvard economist, Robert Barro, tweaked it), Johns Hopkins Professor Steve Hanke decided to add interest rates and growth. More precisely, he totaled the unemployment, inflation, and bank lending rates. Then, from that number, he subtracted the percent change in per capita GDP growth. When the first three rise, they are the “bads.” But if the last one goes up, it is a “good.” Recently though, his index changed a bit when he decided to double the unemployment rate component. In the Hanke Index, called HAMI, high numbers are alarming.
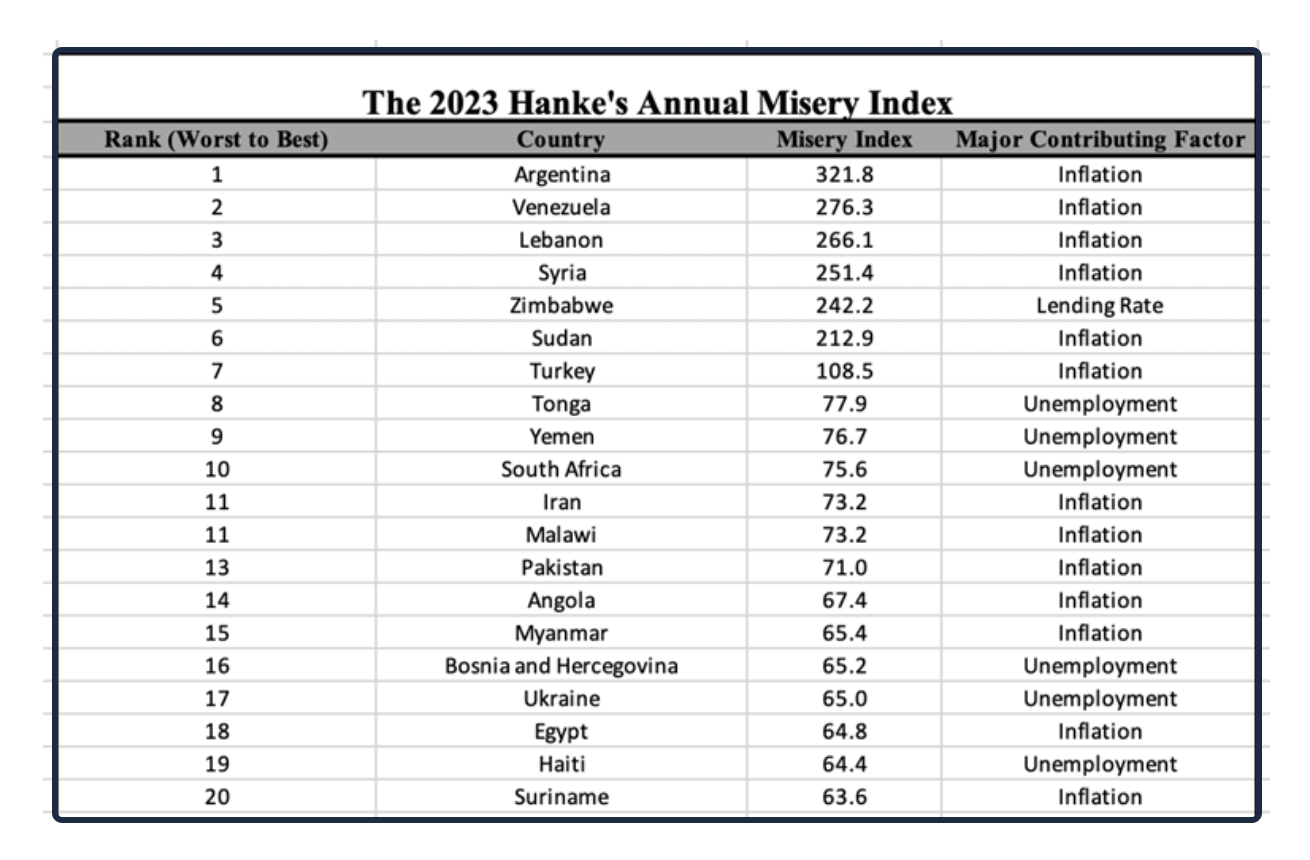
HAMI’s Most and Least Miserable Nations
Among the most miserable, Argentina (321.8) and Venezuela (276.3) topped a list of 157. While hyperinflation fueled most countries’ unhappiness, for some like South Africa, it was unemployment:
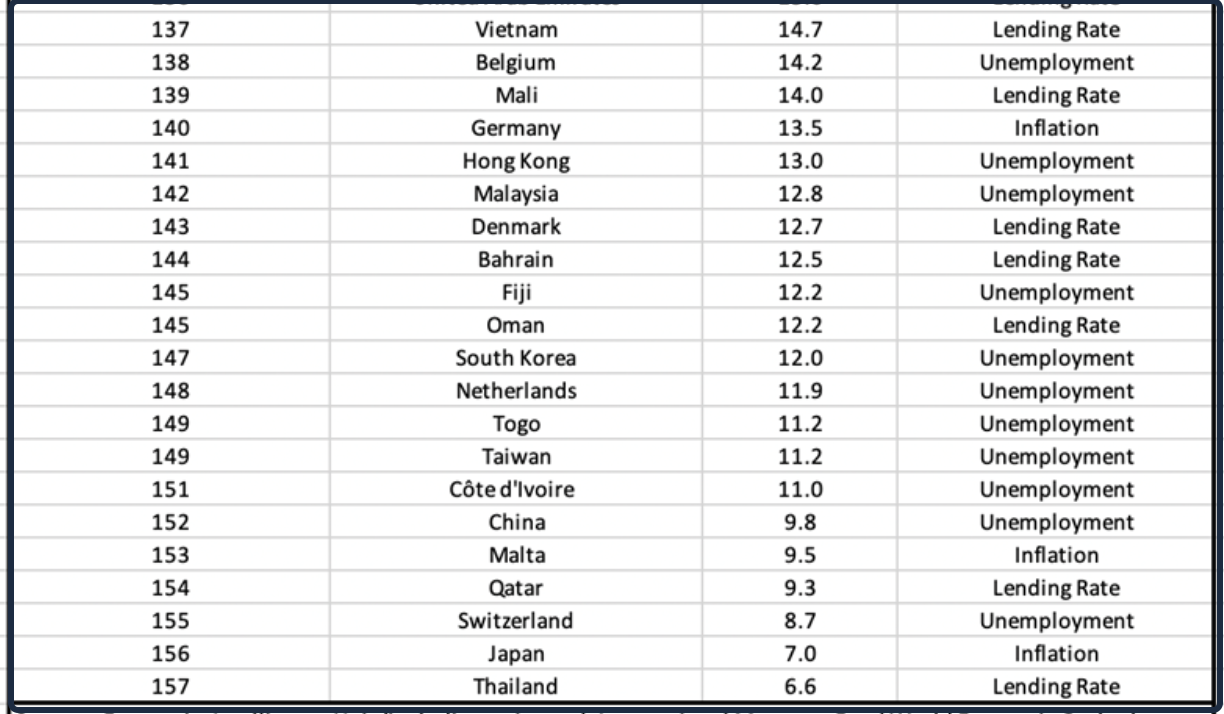
Meanwhile, the bottom 20 were happiest:
So, we can wonder, with U.S. unemployment so low and the inflation rate having descended into happy territory, why aren’t we happier?
My sources and more: Returning again to the Misery Index and HAMI, I discovered a newsletter from economist Paul Krugman for extra insight. And finally, you might have some fun (as did I) considering ESPN’s sports Misery Index.
Please note that today, we updated and revised a previous post.


