What a Disaster Can Cost Us
January 7, 2021January 2021 Friday’s e-links: From Flamin’ Hot Cheetos to An Alaskan Earthquake
January 8, 2021If you compare the S&P 500, a Covid-19 timeline, and economic fundamentals you might wind up rather perplexed.
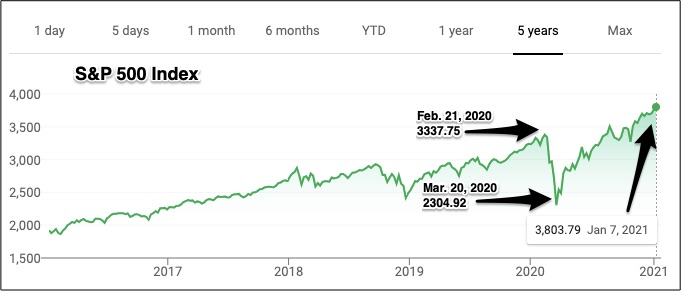
We can start with the S&P 500. Between February 21 and March 20, 2020, the Index plunged by close to 30 percent. But then, you could have drawn an S&P “V”:
Meanwhile, as all NYC public schools, bars and restaurants (except for delivery) closed on March 16 and 17, Covid’s spread became very real. On March 20, where the V starts its ascent, New York’s Governor Cuomo mandated that all nonessential businesses close. (On June 8th, the first phase for reopening began.)
At this point we can ask about the connection.
Stock Market Fluctuations
In a September 2020 NBER Working Paper, three economists tried to explain stock market fluctuations during the earliest weeks of the pandemic. In a logical, quantifiable world, a look at corporate profits, interest rates, and other economic fundamentals should provide some answers. Then, if we throw in a slew of other variables our equations will establish correlation (and maybe causation).
Not necessarily.
The researchers did conclude that some Fed announcements had a minor impact on stock market movements. However, trying to create a coherent rationale for fluctuations during 30 minute intervals, they had no success. Consequently, I can only quote the end of the last sentence of their paper: “…stock market volatility during the coronavirus pandemic has been driven more by sentiment than substance.”
Our Bottom Line: Measuring Uncertainty
Maybe it all adds up to uncertainty.
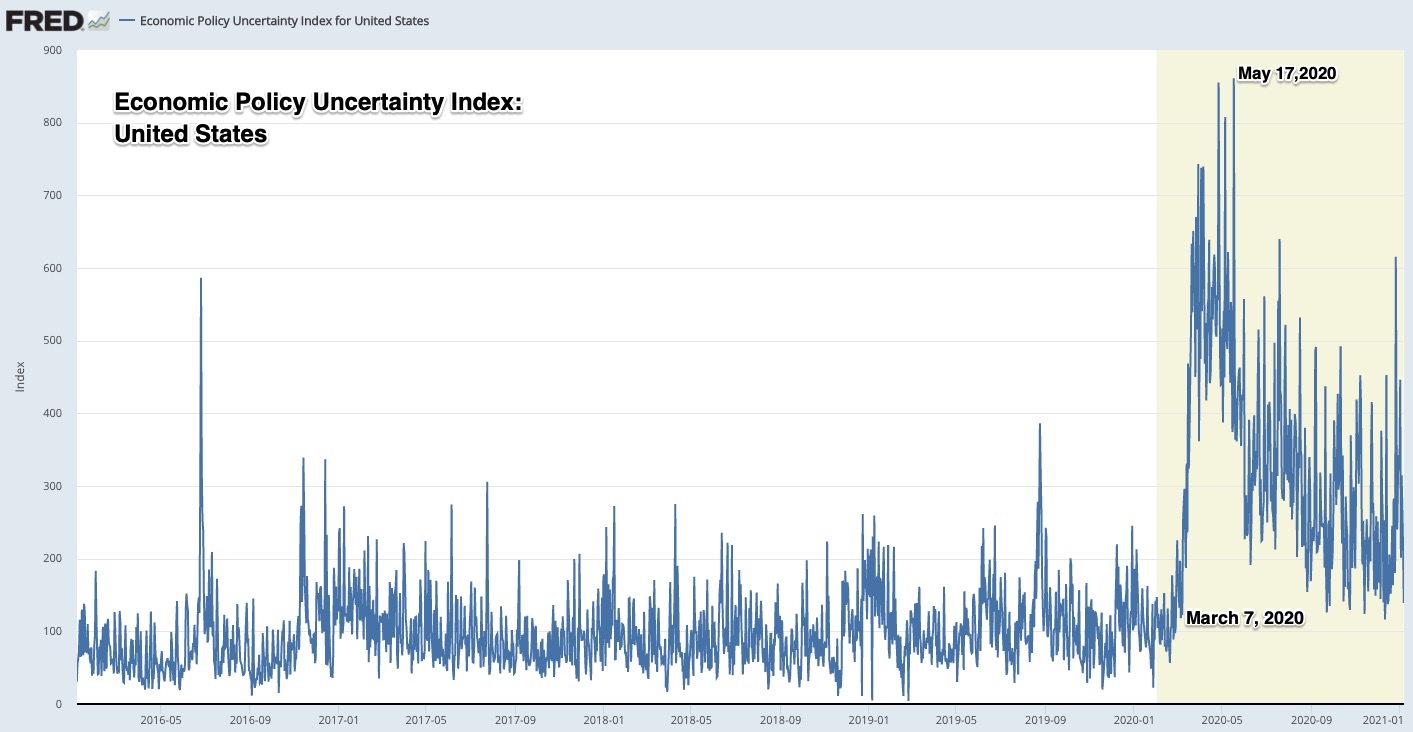
Hoping to predict economic activity, one group of economists created an Economic Policy Uncertainty Index that is based three categories of data. The Index gathers words that relate to uncertainty and the economy in ten prominent newspapers. It also quantifies temporary federal tax provisions that could change and checks for economic forecasting disagreement.
You can see that the Uncertainty Index starts its sky high ascent during the beginning of March. The last dot on the graph is two days ago, January 6. Even after its recent decline, the Index still is elevated when compared to a pre-2020 pre-pandemic world:
Where does all of this leave us? Because uncertainty can depress business investment and consumer spending, we can hope that the descent of the uncertainty policy line signals the potential of a happy new year with a new president and Covid-19 vaccinations multiplying.
My sources and more: It is always fun to return to the Uncertainty Index. I especially enjoyed comparing the U.S. to other nations and the global average. From there, curious, I followed this NBER link to see stock market returns in 1918. However, the most recent NBER paper on stock market fluctuations was most enlightening.
![econlifelogotrademarkedwebsitelogo[1]](/wp-content/uploads/2024/05/econlifelogotrademarkedwebsitelogo1.png#100878)


